The Hidden Power of a Bank Deposit, Part I: What Happens to Your $1,000 After You Click Deposit
In this article
What actually happens to your $1,000 after you click “Deposit”?
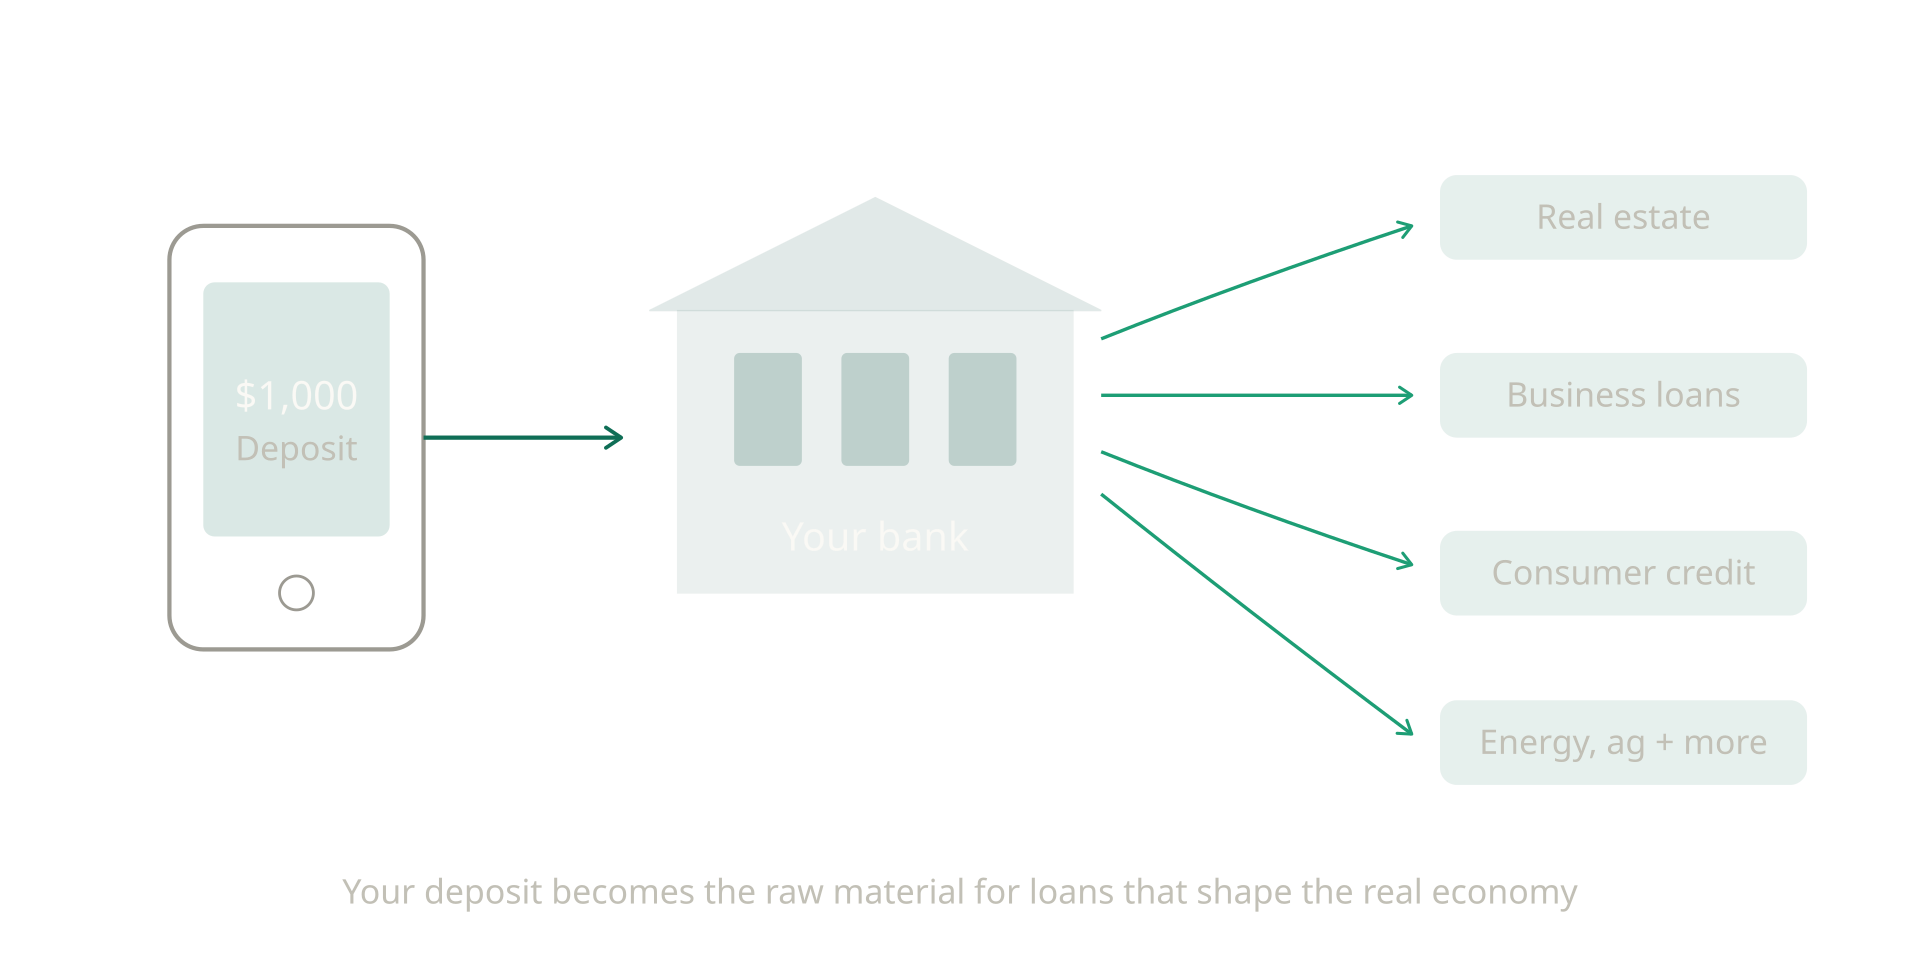
Most people think of a bank deposit as storage; a place where money waits to be used. But that’s not what actually happens inside the financial system.
When you deposit $1,000 into your bank account, that money immediately becomes part of the raw material banks use to make loans. And loans are one of the main instruments determining what gets built, which businesses expand, which homes come to market, which technologies are adopted, and which communities move forward.
Federal Reserve data show that commercial banks’ loans equal about 71% of their deposits [1]. With $18.5 trillion sitting in commercial bank accounts [2], that means roughly $13 trillion of customer deposits are in active use, shaping the direction of the real economy. And because lending patterns follow long-standing structural pathways, your $1,000 doesn’t flow into a vacuum; it flows into a highly patterned system.
In practice, deposit flows shape lending, and lending shapes economic, social, and environmental outcomes. So where does your $1,000 actually go?
The real estate pathway: where nearly half of your $1,000 ends up
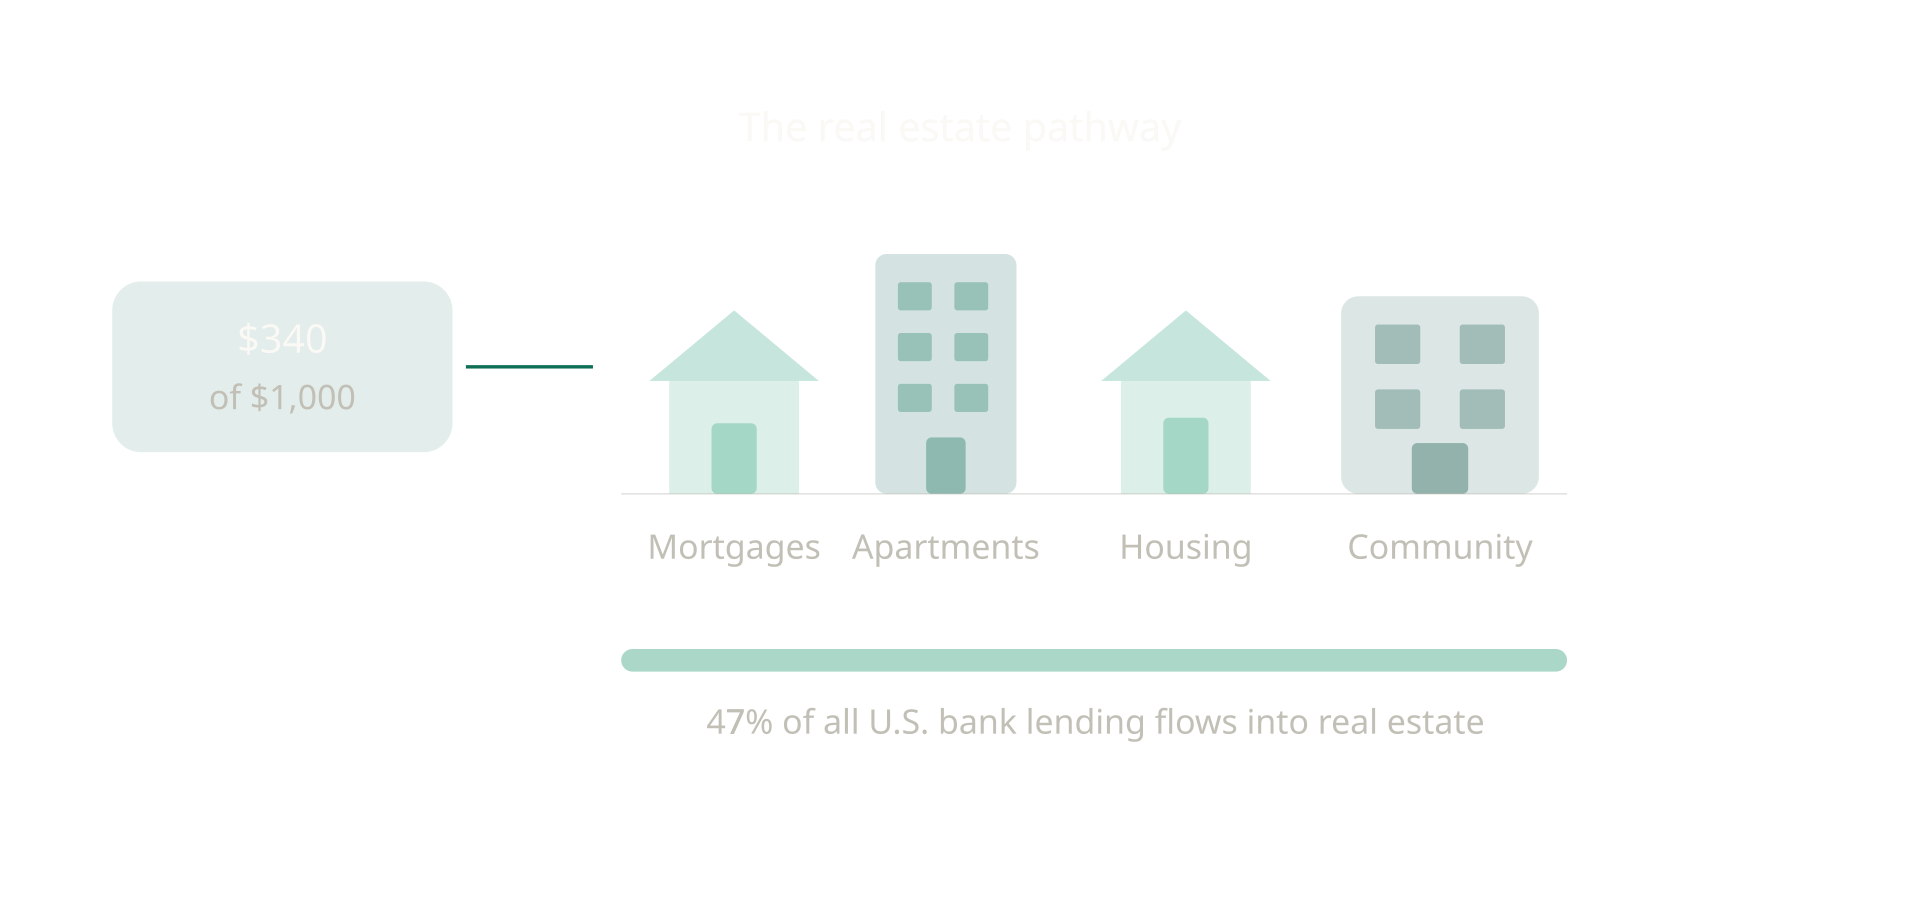
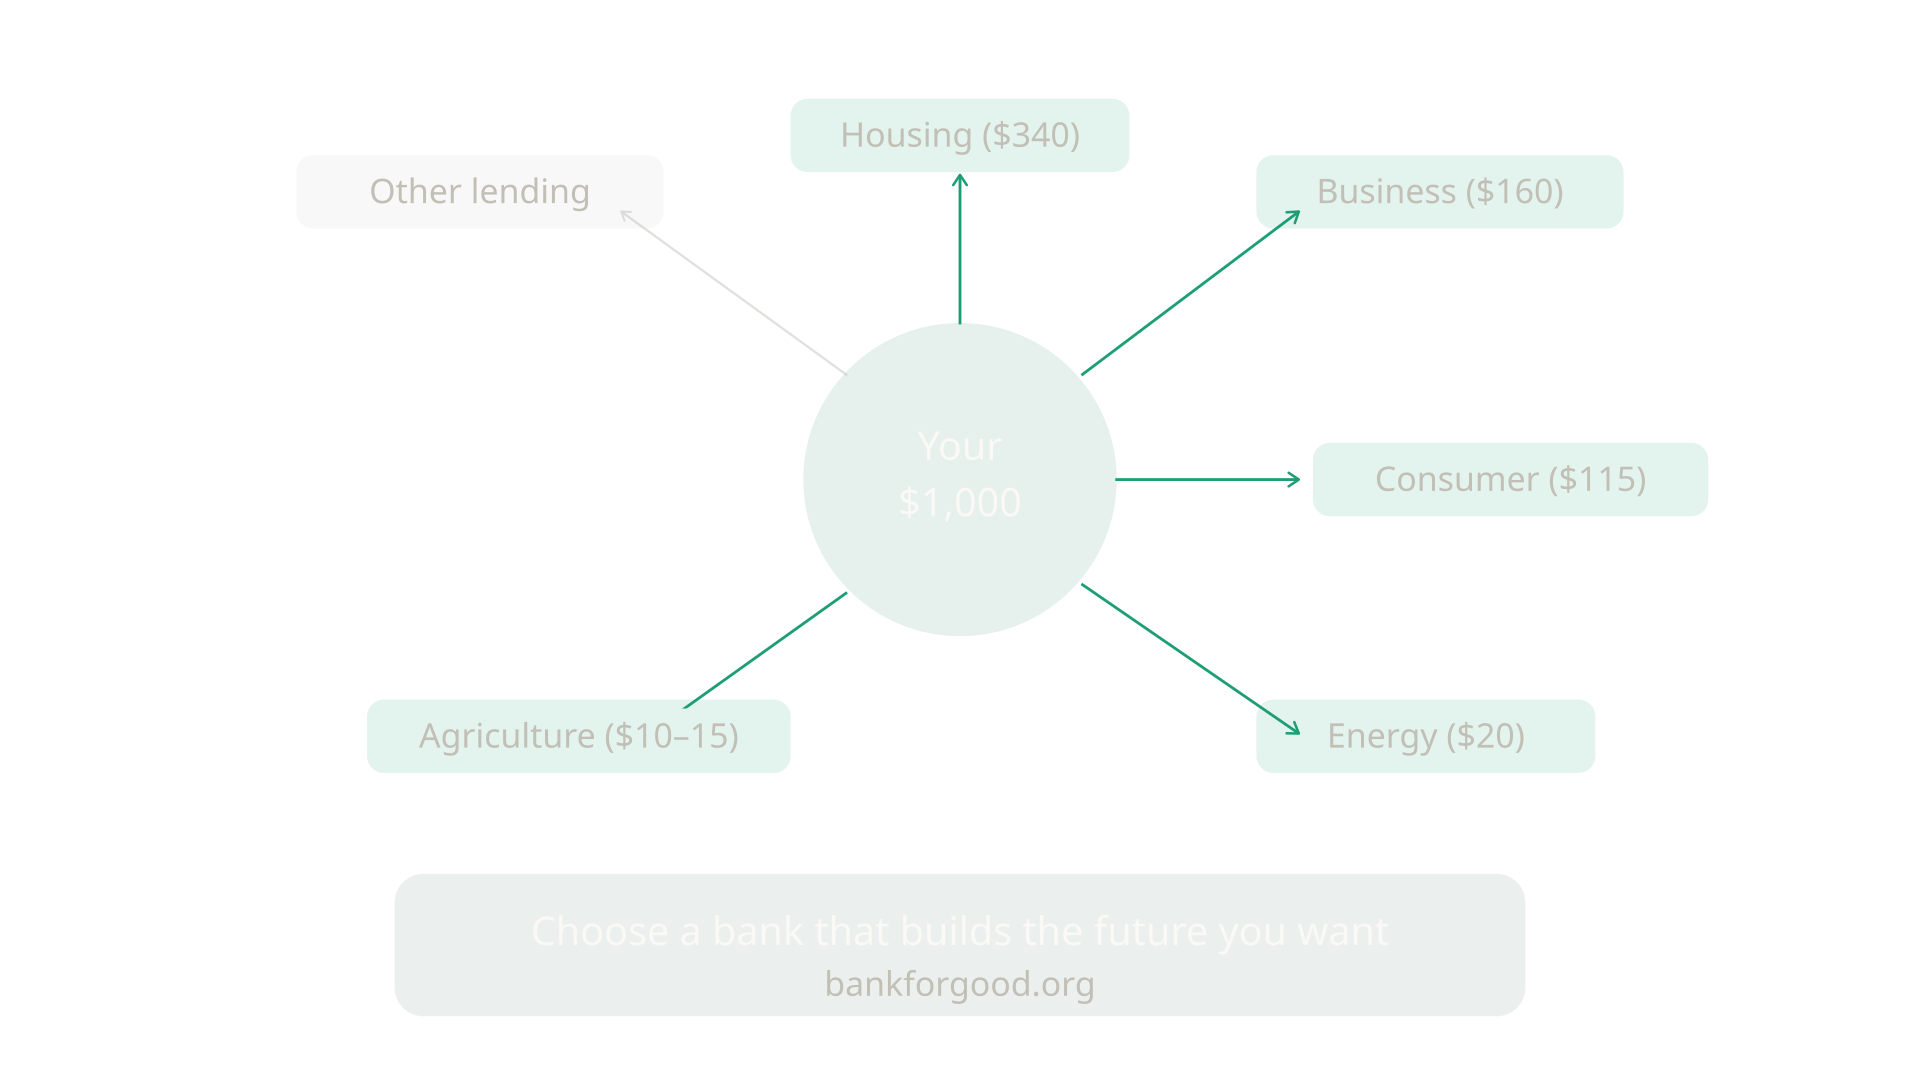
If you deposit $1,000 today, chances are that roughly $340 of it is eventually transformed into some form of real estate credit. Real estate lending is about $6.0 trillion nationwide, roughly 47% of total lending [3], and it remains the single largest destination for bank credit.
And this has consequences: it influences housing construction, home prices, urban development, rental markets, and the physical shape of communities. Your $1,000 may help finance a mortgage, a small apartment building, a community center, or a downtown passive housing redevelopment depending on your bank’s lending priorities.
The business and industry pathway: approximately $160 of your $1,000
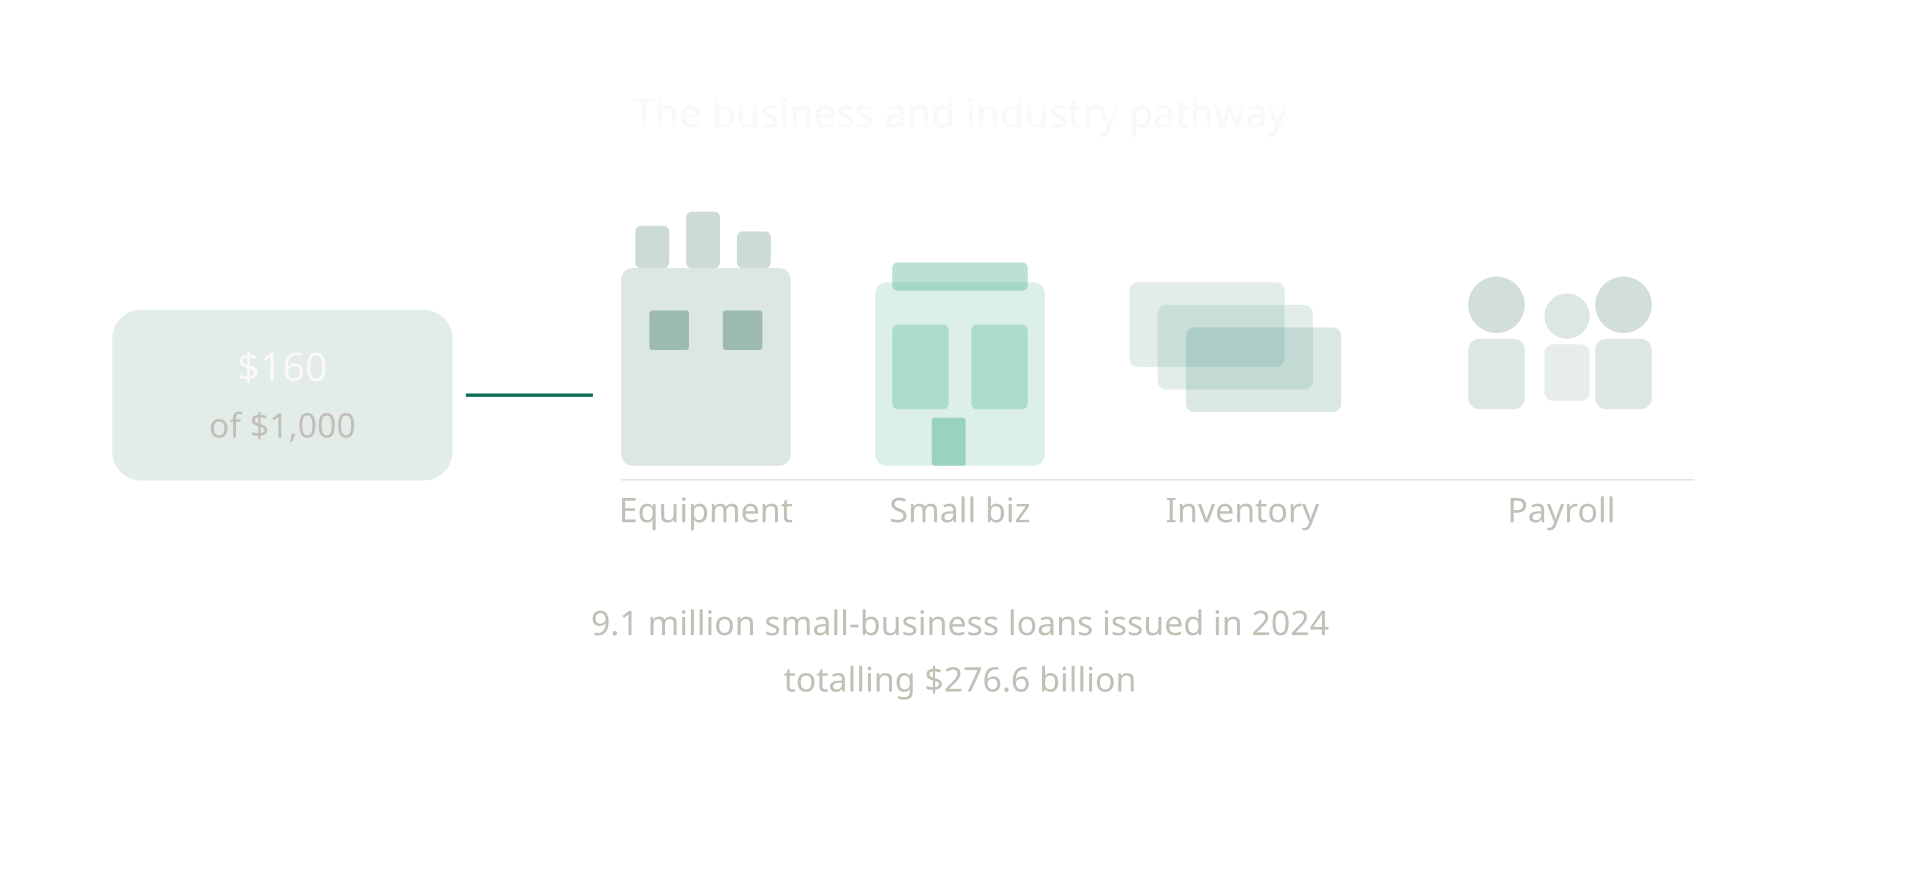
Roughly one-fifth of all bank lending becomes Commercial & Industrial (C&I) credit, i.e. the loans that help businesses grow [4].
If you deposit $1,000, about $160 of that portion is likely to end up flowing into a loan that supports new equipment, inventory, payroll, factory construction and maintenance, supply chain development, energy and grid infrastructure and local business expansion. In 2024 alone, banks reporting under the Community Reinvestment Act reported about 9.1 million small-business loans of $1 million or less, totaling $276.6 billion [5].
These flows shape entrepreneurship, employment, and local economic opportunity. Your $1,000 may be part of the capital that keeps a restaurant open, helps a manufacturer upgrade machinery, or allows a local business to hire its next employee.
The consumer pathway: about $115 of your $1,000
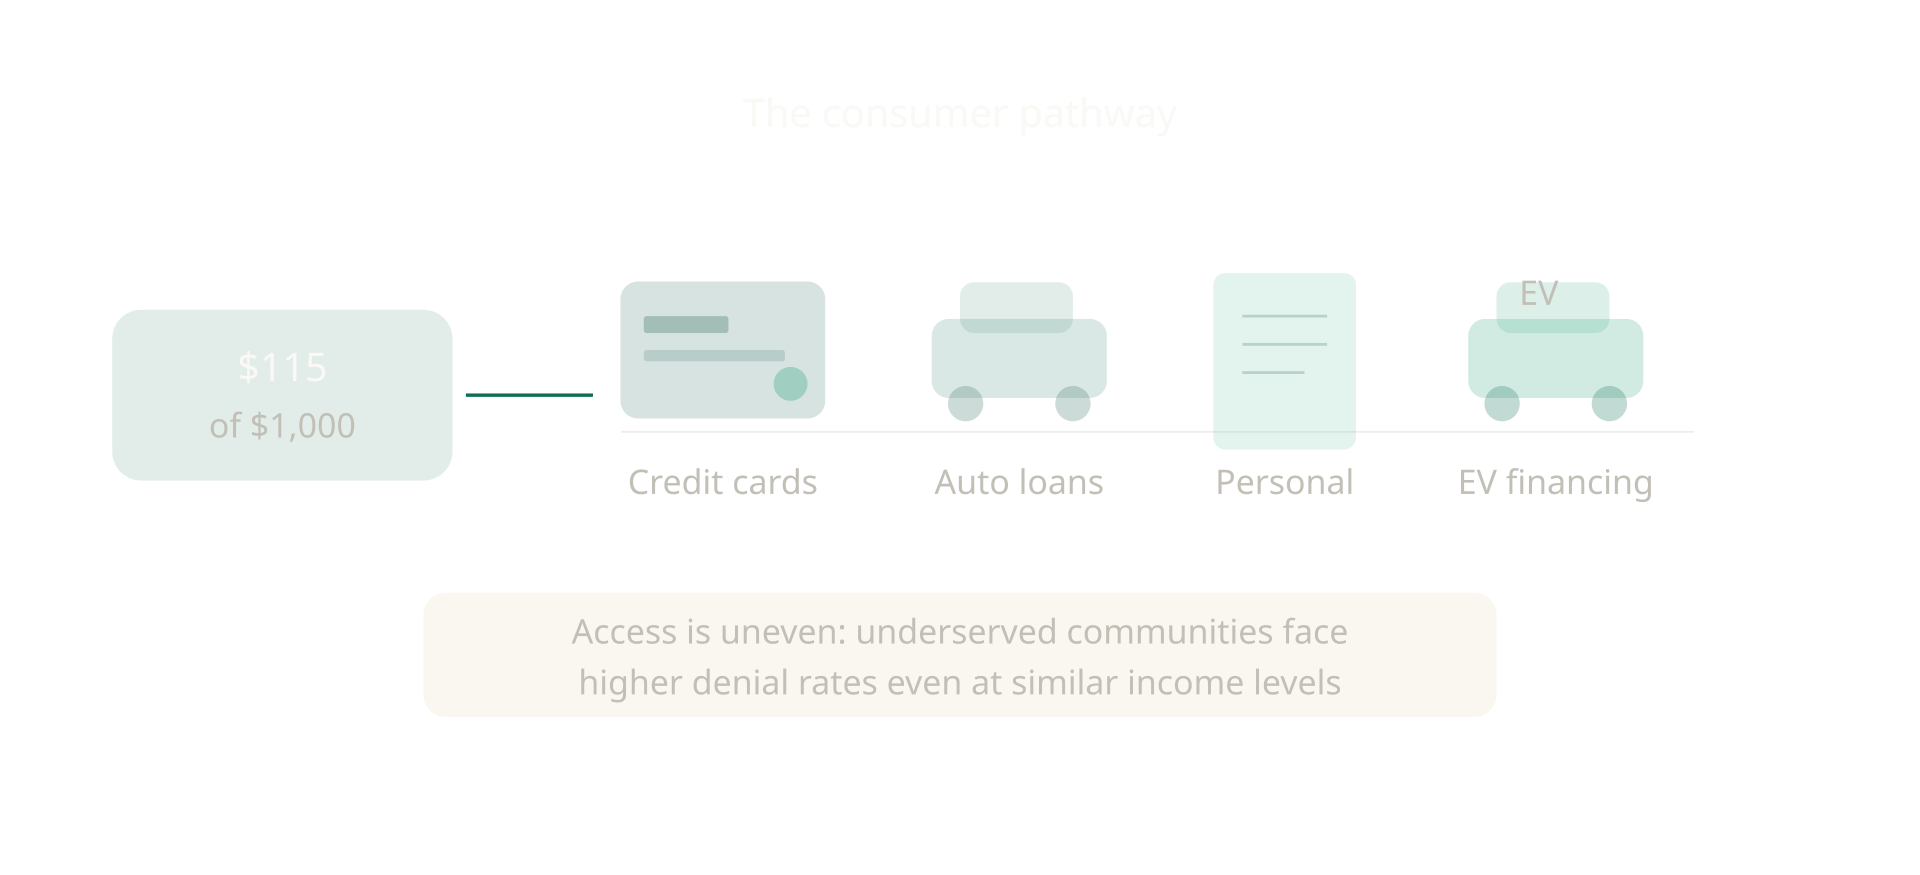
Consumer credit represents roughly 15–20% of the loans that U.S. banks hold on their balance sheets [6]. In the $1,000 story, this means approximately $105–$140 of the deposit-funded lending your bank performs ultimately becomes credit-card balances, auto loans, personal loans and other household credit.
These flows finance essential mobility, household stability, and short-term resilience; all of which are core drivers of U.S. economic activity.
Access to these forms of credit is not evenly distributed though. Research from the Federal Reserve shows that credit outcomes varied by both income level and demographic factors, however applicants from historically underserved communities report higher denial rates even when comparing similar income levels [7].
Because EV purchases increasingly depend on access to affordable credit, your deposits indirectly influence who is able to adopt electric vehicles. In the fourth quarter of 2024, 9.3% of all new vehicles purchased in the U.S. were electric, and 38.9% of those were financed through loans [8].
The consumer-credit slice of your $1,000 helps determine who can access electric vehicles and newer transportation options, who can weather financial shocks, and who ends up paying more just to participate in daily life. Ultimately, consumer loans shape which households gain access to financing that supports stability, opportunity, and access to newer technologies.
The agricultural pathway: only a few dollars, but outsized impact
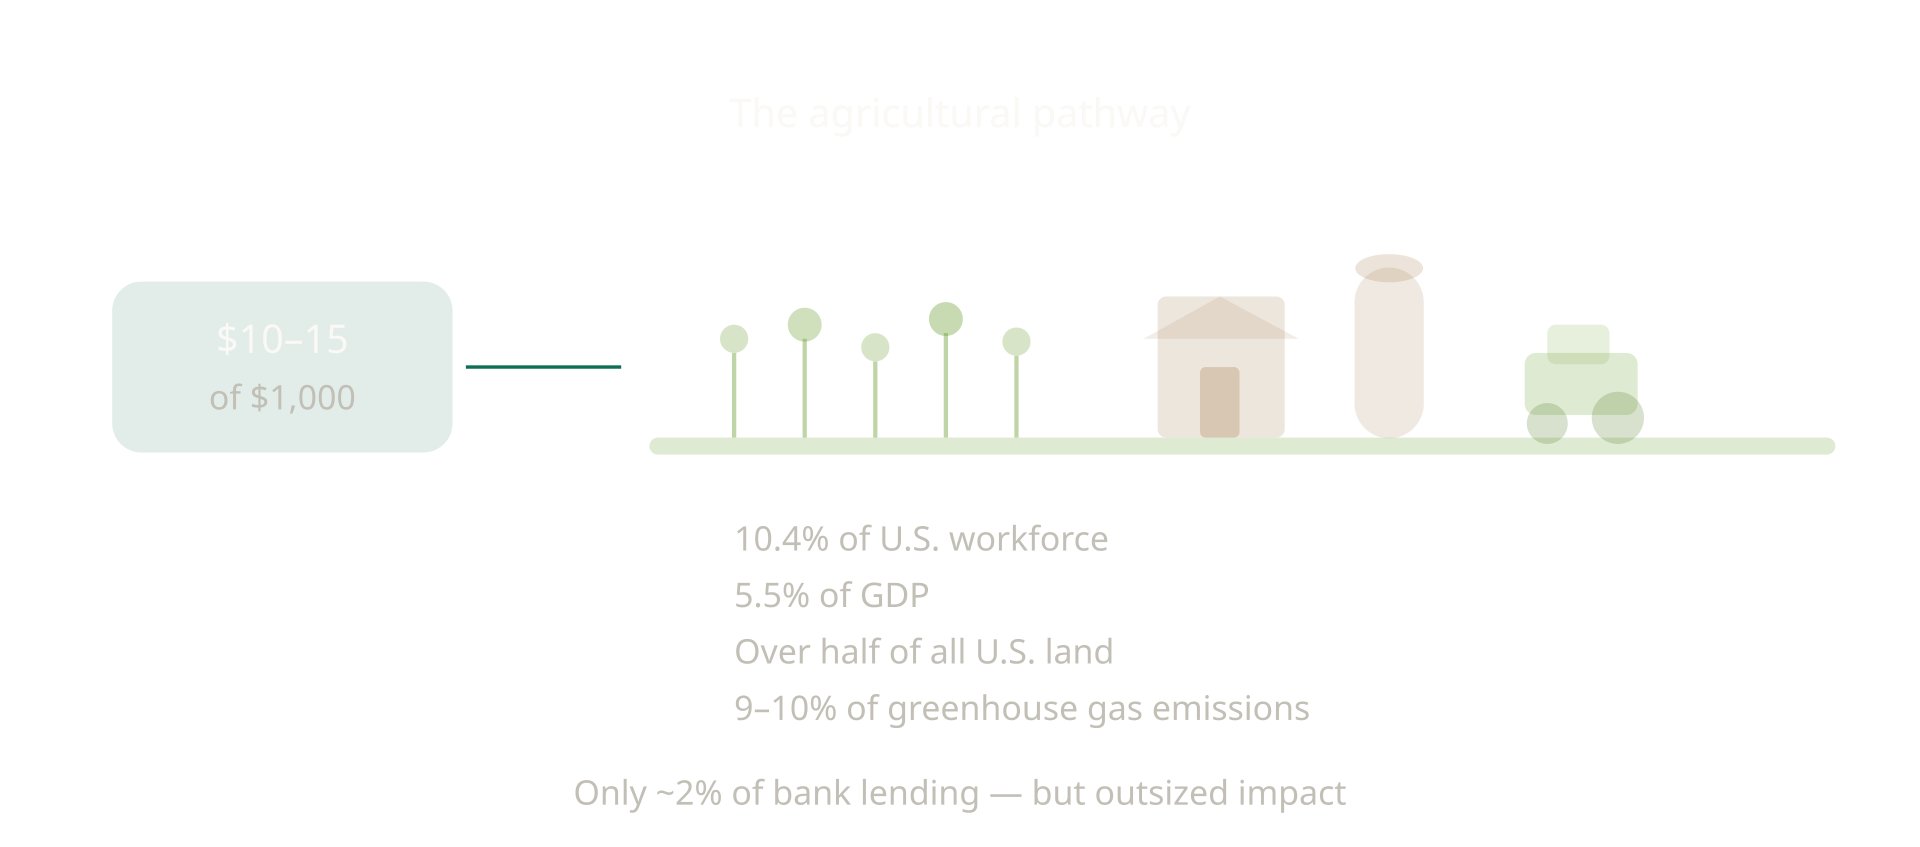
Agriculture receives under 2% of total bank lending, about $205 billion [9]. So from your $1,000 deposit, perhaps only $10–$15 eventually supports U.S. agriculture. But that small flow underpins a sector that, together with the food and related industries it supports, accounts for 10.4% of U.S. jobs (2022) and 5.5% of GDP (2023) [10], spans over half of all U.S. land [11] and generates 9–10% of U.S. greenhouse gas emissions [12], making it a significant sector for infrastructure and emissions-related investments.
Agricultural loans may be a narrow slice of bank portfolios, but they play a central role in food production, rural economic stability, and the environmental trajectory of millions of acres of working land. Even a few dollars of your deposit help keep that system operating or modernizing.
The energy pathway: about $20 of your $1,000
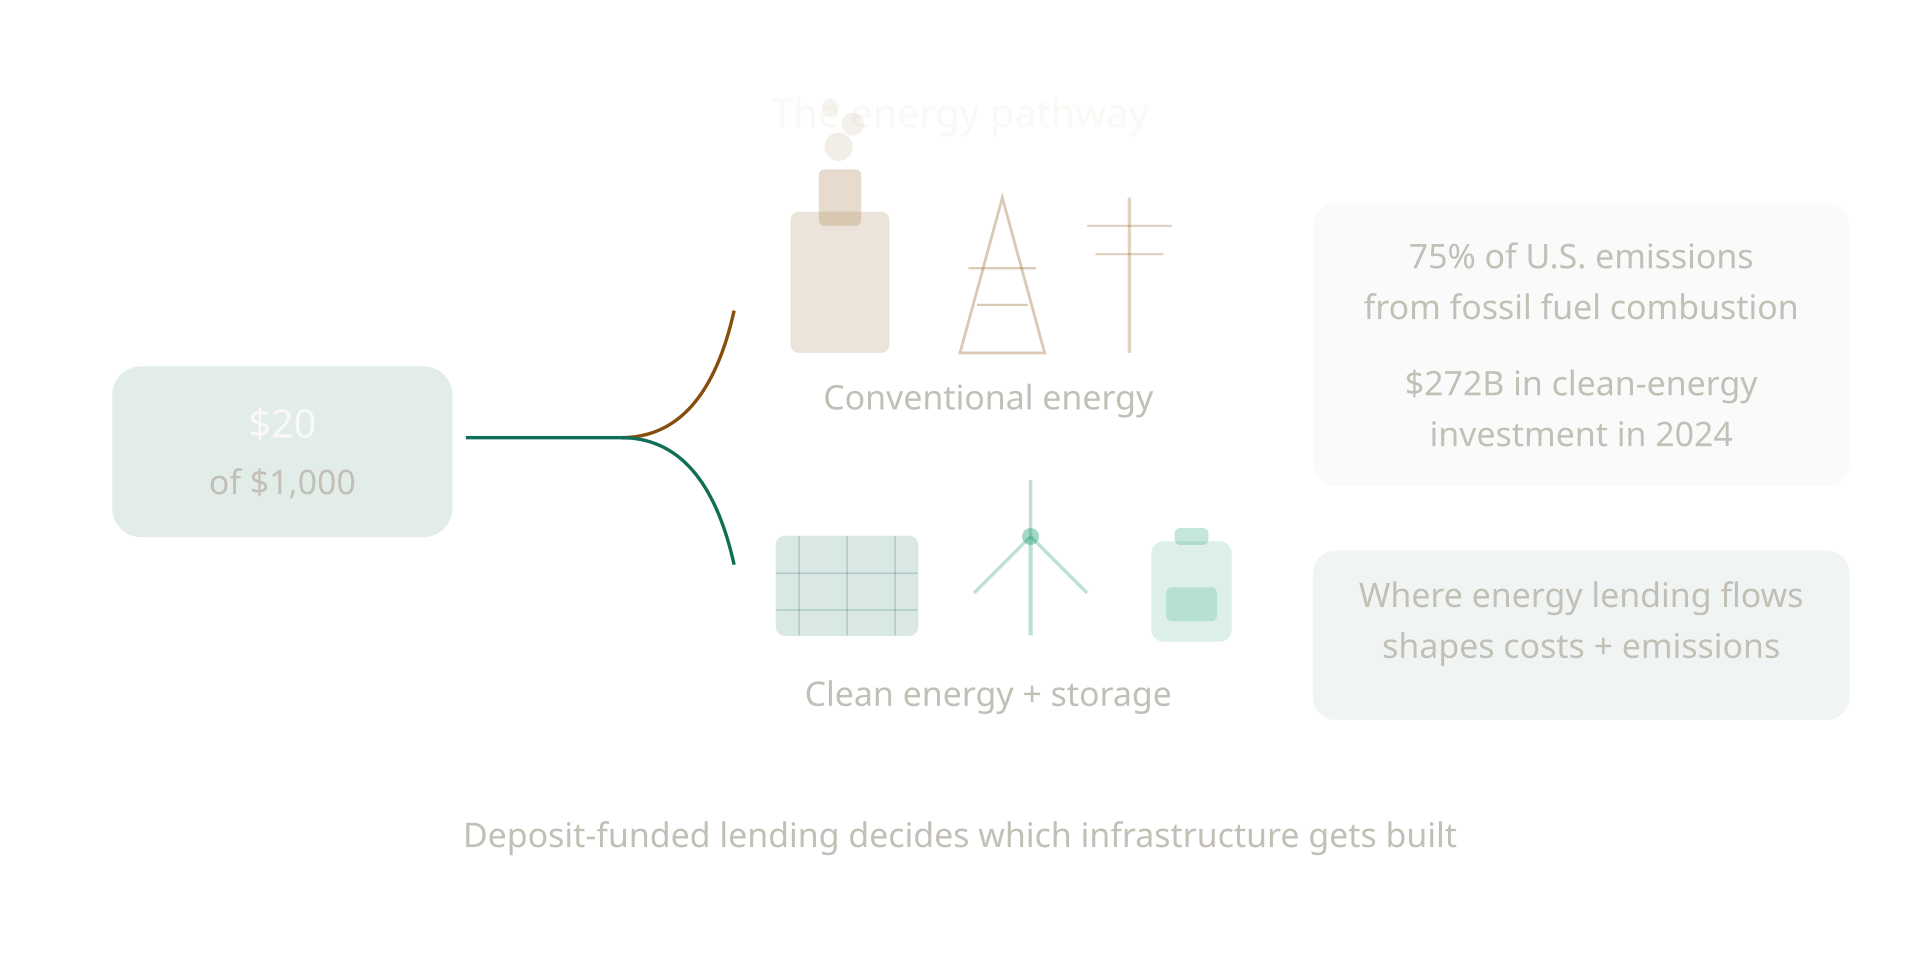
Energy is one of the most capital-intensive parts of the U.S. economy, and therefore a large destination for deposit-funded commercial lending. If you deposit $1,000, roughly $20 of the loaned portion ultimately flows into some part of the energy system including conventional energy infrastructure, regulated utilities, or emerging clean-energy technologies.
Federal Reserve data shows that U.S. banks hold $2.7 trillion in Commercial & Industrial (C&I) loans [4]. Although regulators do not publish a granular breakdown of how much of this lending goes to energy borrowers, one study found that about 13.5% of the syndicated loans made by the 20 largest U.S. banks went to energy firms [13].
Bank involvement in the conventional energy system also appears in capital-markets activity. In 2024, U.S. banks participated in $289 billion in fossil-fuel financing [14]. Not all of this is deposit-funded lending, but it illustrates how deeply embedded long-lived conventional energy assets remain in financial portfolios.
At the same time, banks are expanding financing for emerging energy technologies. U.S. clean investment reached $272 billion in 2024 [15]. This includes commercial solar, battery storage, efficient buildings, electrification upgrades, and community-scale energy systems.
Energy lending determines which infrastructure gets built and maintained, with cascading effects on costs, emissions, and community outcomes. Fossil-fuel combustion still accounts for roughly three-quarters of U.S. greenhouse gas emissions, with the power sector accounting for about 30% of energy-related CO2 emissions [16]. Because banks supply significant capital to this system, deposit-funded lending flows, toward established infrastructure or emerging alternatives, shape energy costs, emissions outcomes, and infrastructure resilience nationwide.
- Energy burden: One in four low-income households spends over 15% of income on energy bills, a burden that access to efficiency upgrades could significantly reduce [17].
- Health and economic costs: Air pollution from burning fossil fuels contributes to respiratory illness and premature death. The health costs of fossil-fuel air pollution and climate change in the U.S. exceed $800 billion a year [18].
- Technology access: Only 16% of U.S. homes use heat pumps for space heating and just 1% use heat-pump water heaters [19]. Affordable financing helps households cover the upfront cost of these systems.
- Grid resilience: A 2025 study of small residential communities found that vulnerability to power outages varies widely between neighborhoods, depending on outage risk and residents’ capacity to cope [20]. Where grid lending flows determines which neighborhoods gain access to reliable, resilient electricity infrastructure.
Across affordability, grid reliability, air quality, emissions, and access to modern technologies, the flow of deposit-funded lending becomes the flow of opportunity. Even a small share of your $1,000 helps shape the energy systems people depend on every day.
Closing the loop: what your $1,000 ultimately means
When you step back, the story behind your $1,000 deposit is surprisingly straightforward: it becomes part of the capital that decides what the country builds, maintains, and prioritizes.
It helps determine whether a town gets new housing and at what price, whether a small business can expand, whether farms get the credit they need, whether the grid becomes more reliable, and whether families can access lower-cost technologies that shape long-term living standards.
None of this happens overnight, and none of it is driven by any single person’s deposit. But in the aggregate, deposits are one of the most powerful and most overlooked drivers of economic, social, and environmental outcomes in the United States. And because deposits flow through such predictable channels, your financial choices quietly influence which systems grow, which modernize, and which fall behind.
This leads to a simple, practical takeaway: one of the most meaningful actions you can take is to understand how banking works and then choose a bank that aligns with the future you want to support.
This isn’t about purity or pressure. It’s about awareness, transparency, and using one of the easiest levers available to shape real-world outcomes.
That is why Bank for Good exists: to make these systems visible, accessible, and understandable; to help people see where their money goes after it leaves their account; and to provide a clear path toward banking choices that strengthen communities, broaden opportunity, and support a more resilient, future-ready economy.
Your $1,000 doesn’t sit still. It flows into different sectors of the economy. Banking with awareness means understanding those flows.
Next: Part II: Where you bank shapes where your $1,000 goes
A note on how lending data works in this article
Throughout this analysis, lending figures refer specifically to the loans that banks retain on their balance sheets, as reported in the Federal Reserve’s H.8 release (data for October 2025, published November 2025) and the FDIC Quarterly Banking Profile (fourth quarter 2024). In practice, banks originate far more credit than they ultimately hold as many loans are later sold, securitized, or transferred to government-sponsored entities or non-bank lenders. This means total credit in the economy is larger than bank-held balances, but the lending pathways described here reflect the portion directly enabled by commercial bank deposits.
Sources
- Federal Reserve H.8 Release, “Assets and Liabilities of Commercial Banks in the United States” (Table 2, seasonally adjusted, billions of dollars, line 9 “Loans and leases in bank credit” and line 34 “Deposits”) (Nov 2025). https://www.federalreserve.gov/releases/h8/20251121/
- Federal Reserve H.8 Release, “Assets and Liabilities of Commercial Banks in the United States” (Table 2, seasonally adjusted, billions of dollars, line 34 “Deposits”) (Nov 2025). https://www.federalreserve.gov/releases/h8/20251121/
- Federal Deposit Insurance Corporation (FDIC), Quarterly Banking Profile, Fourth Quarter 2024 (balance sheet of FDIC-insured institutions, “Loans secured by real estate” and “Total loans and leases”) (2025). https://www.fdic.gov/quarterly-banking-profile/quarterly-banking-profile-q4-2024
- Federal Reserve H.8 Release, “Assets and Liabilities of Commercial Banks in the United States” (Table 2, seasonally adjusted, billions of dollars, line 10 “Commercial and Industrial Loans”) (Nov 2025). https://www.federalreserve.gov/releases/h8/20251121/
- Federal Financial Institutions Examination Council (FFIEC), “Findings from Analysis of Nationwide Summary Statistics for 2024 Community Reinvestment Act Data” fact sheet (2025). https://www.ffiec.gov/data/cra/findings-from-2024-data-fact-sheet
- Federal Deposit Insurance Corporation (FDIC), Quarterly Banking Profile, Fourth Quarter 2024 (balance sheet of FDIC-insured institutions, “Loans to individuals” and “Total loans and leases”) (2025). https://www.fdic.gov/quarterly-banking-profile/quarterly-banking-profile-q4-2024
- Board of Governors of the Federal Reserve System, Economic Well-Being of U.S. Households in 2023, Section 5: Banking and Credit (May 2024). https://www.federalreserve.gov/publications/2024-economic-well-being-of-us-households-in-2023-banking-credit.htm
- Experian, “The Current State of EV Financing: Why More Consumers Are Choosing Leasing” (6 March 2025). https://www.experian.com/blogs/insights/auto-the-current-state-of-ev-financing-why-more-consumers-are-choosing-leasing/
- Federal Deposit Insurance Corporation (FDIC), Quarterly Banking Profile, Fourth Quarter 2024 (balance sheet of FDIC-insured institutions, “Farm loans” and “Loans secured by real estate: farmland”) (2025). https://www.fdic.gov/quarterly-banking-profile/quarterly-banking-profile-q4-2024
- United States Department of Agriculture, Economic Research Service (USDA ERS), “Ag and Food Sectors and the Economy” (2024). https://www.ers.usda.gov/data-products/ag-and-food-statistics-charting-the-essentials/ag-and-food-sectors-and-the-economy/; and “Agriculture and its related industries provide 10.4 percent of U.S. employment” (chart, 2023). https://www.ers.usda.gov/data-products/chart-gallery/58282
- USDA ERS, “Major Land Uses” (2022 data). https://www.ers.usda.gov/topics/farm-economy/land-use-land-value-tenure/major-land-uses
- United States Environmental Protection Agency (EPA), “Sources of Greenhouse Gas Emissions: Agriculture Sector Emissions” (2022). https://www.epa.gov/ghgemissions/agriculture-sector-emissions
- Nguyen et al., “Climate transition risk in U.S. loan portfolios: Are all banks the same?”, International Review of Financial Analysis, vol. 85 (2023). https://www.sciencedirect.com/science/article/abs/pii/S1057521922003519
- Rainforest Action Network et al., “Banking on Climate Chaos 2025: Fossil Fuel Finance Report” (2025). https://www.ran.org/press-releases/bocc2025/
- Clean Investment Monitor, Q4 2024 Update (February 2025). https://cdn.prod.website-files.com/64e31ae6c5fd44b10ff405a7/681a5f71393040f8a650ce77_Clean%20Investment%20Monitor_Q4%202024%2002%20Update.pdf
- U.S. Energy Information Administration (EIA), “Where Greenhouse Gases Come From” (2024). https://www.eia.gov/energyexplained/energy-and-the-environment/where-greenhouse-gases-come-from.php
- American Council for an Energy-Efficient Economy (ACEEE), “Energy Burden in the United States” (2024). https://www.aceee.org/energy-burden
- Natural Resources Defense Council (NRDC), Medical Society Consortium on Climate & Health, Wisconsin Health Professionals for Climate Action, “The Costs of Inaction: The Economic Burden of Fossil Fuels and Climate Change on Health in the United States” (2021). https://www.nrdc.org/resources/costs-inaction-economic-burden-fossil-fuels-and-climate-change-health-us
- Rewiring America, “Pace of Progress: Electrifying everything at the rate required to meet our climate goals” (2024). https://www.rewiringamerica.org/research/pace-of-progress-home-electrification-transition
- Ezzati, F. et al., “Power outage-risk integrated social vulnerability analysis highlights disparities in small residential communities”, Communications Earth & Environment 6, 294 (2025). https://doi.org/10.1038/s43247-025-02278-1

