The Hidden Power of a Bank Deposit, Part II: Where You Bank Shapes Where Your $1,000 Goes
In this article
In Part I, we followed your $1,000 as it entered the banking system and flowed into real estate, small-business lending, consumer credit, agriculture, and energy. We showed that a deposit serves as active capital. And capital shapes the real economy.
But there is a deeper layer behind that story: the type of institution that holds your deposit profoundly changes how that $1,000 is ultimately used.
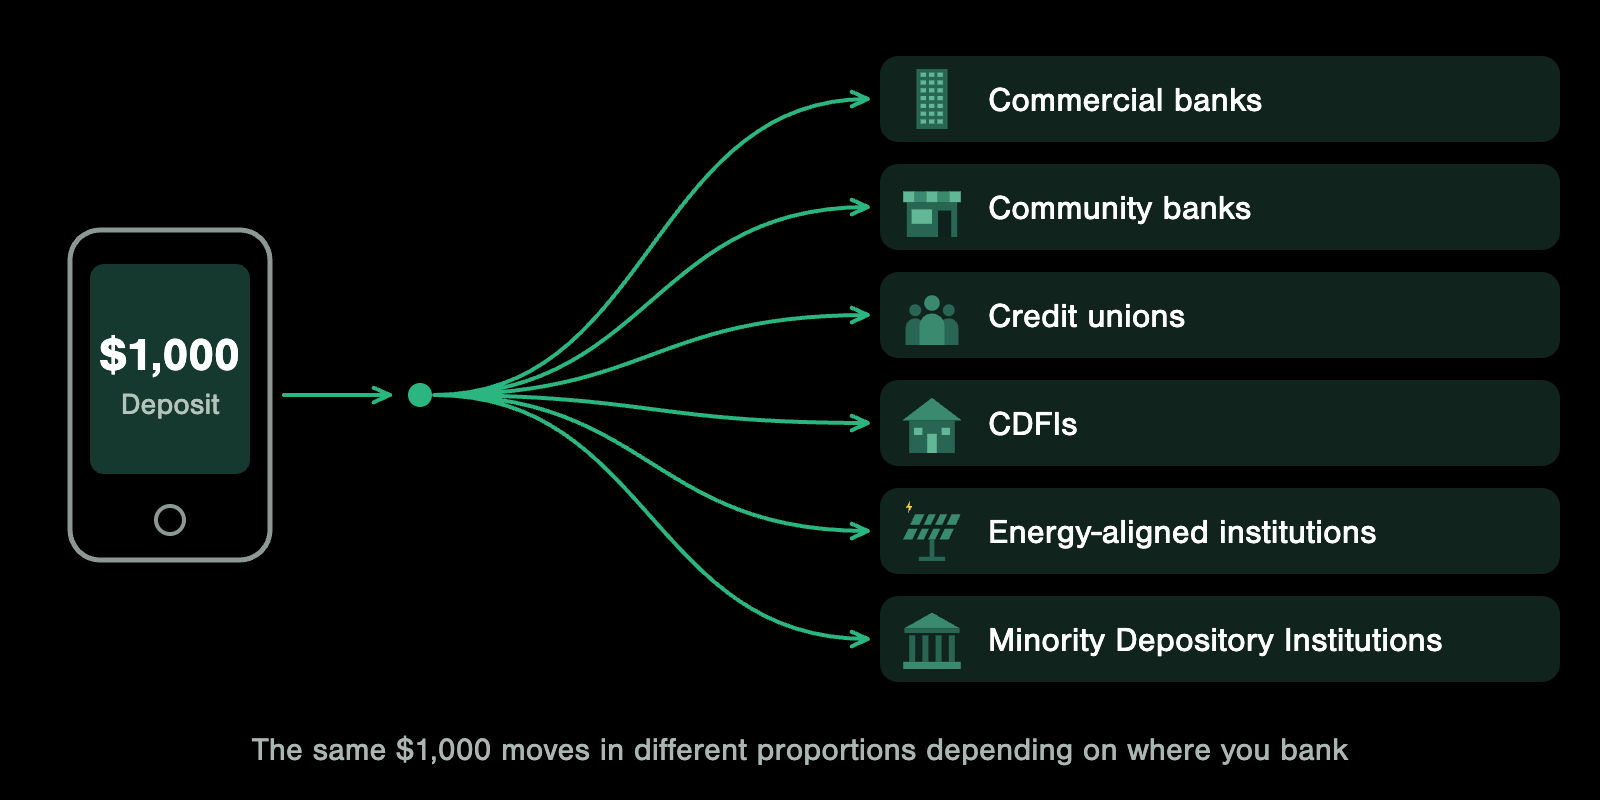
Different institutions lend differently because their missions differ, their balance sheets differ, their regulatory frameworks differ, and their exposure to different sectors differs. The exact same $1,000 deposit will move in different proportions depending on where you bank.
So in this second part, let’s follow your $1,000 again, focusing this time on institution types.
A note on how these institution profiles are determined
To keep this analysis neutral and consistent, the breakdowns below use Federal Reserve H.8 data for commercial bank balance sheets [1], FDIC and NCUA call reports for community bank and credit union lending structures [2][3], U.S. Treasury CDFI Fund data for CDFI lending composition [4], OCC and FDIC MDI reports for Minority Depository Institution missions [5], and publicly reported lending portfolios of specific example institutions. Banks keep part of their deposits as cash, reserves and securities rather than lending all of it, so the figures below describe how the loaned portion is distributed.
Commercial banks: where your $1,000 supports large-scale, mixed-sector lending
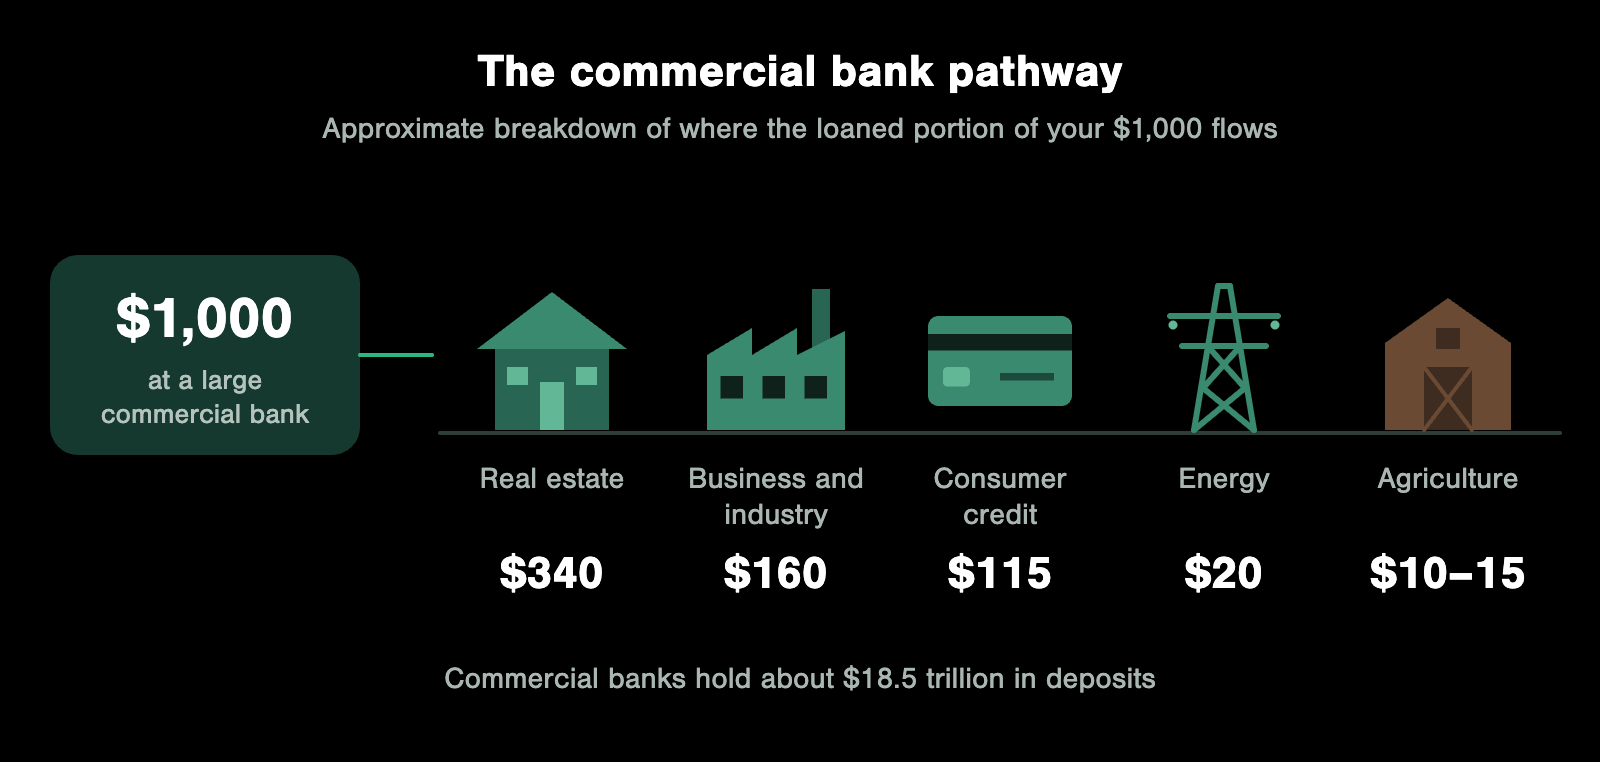
Commercial banks hold about $18.5 trillion in deposits [1]. They lend at scale into real estate, commercial and industrial sectors, consumer credit, infrastructure, and long-lived energy systems. Real estate accounts for roughly 47% of lending [6], commercial and industrial loans make up about 20% [7], and consumer lending represents another 15-20% [8].
If you deposit $1,000 at a large commercial bank, here is the approximate breakdown of where the loaned portion tends to flow, using the same baseline from Part I:
| Sector | Approximate allocation per $1,000 |
|---|---|
| Real estate | $340 |
| Business and industry | $160 |
| Consumer credit | $115 |
| Energy | $20 |
| Agriculture | $10 to $15 |
Think of institutions like Chase, Bank of America, Wells Fargo, PNC, and U.S. Bank. What this means is that commercial banks play a systemic role. They maintain older infrastructure and fund newer systems simultaneously. Your $1,000 participates in both the legacy economy and the emerging one at once.
Regional and community banks: where more of your $1,000 stays local
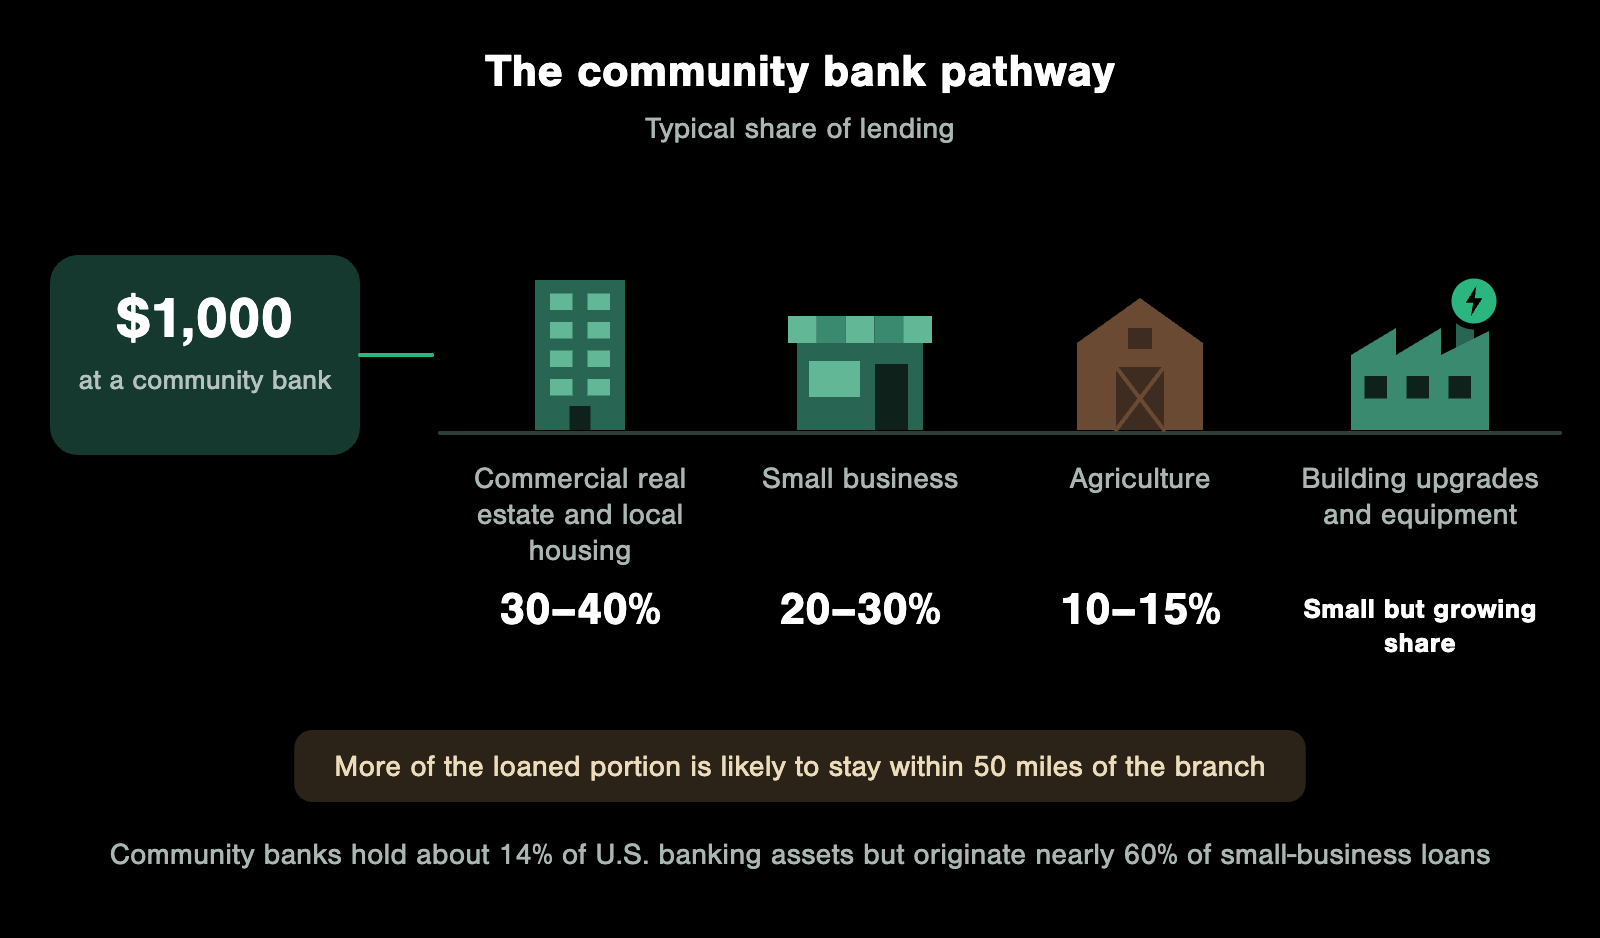
Community banks hold about 14% of U.S. banking assets but originate nearly 60% of small-business loans [2][9]. That disproportionate role in small-business lending is the key structural fact about this institution type: their loan books are weighted heavily toward the places they physically operate.
Typical lending composition runs 30-40% into commercial real estate and local housing, 20-30% into small business lending, 10-15% into agriculture, and a small but growing share into building upgrades and equipment modernization [2].
If you deposit $1,000 in a community bank, more of the loaned portion is likely to stay within 50 miles of the branch. Institutions like Southern Bancorp (AR/MS/MO/OK/TX, renaming to Uplift Bank pending regulatory approval) and Bank of Colorado (CO) illustrate this model. What this means is that your $1,000 supports local businesses, local housing, and gradual upgrades to local infrastructure. The geographic concentration makes community banks one of the most direct mechanisms for channeling deposits into neighborhood-level economic outcomes.
Credit unions: where your $1,000 supports households directly
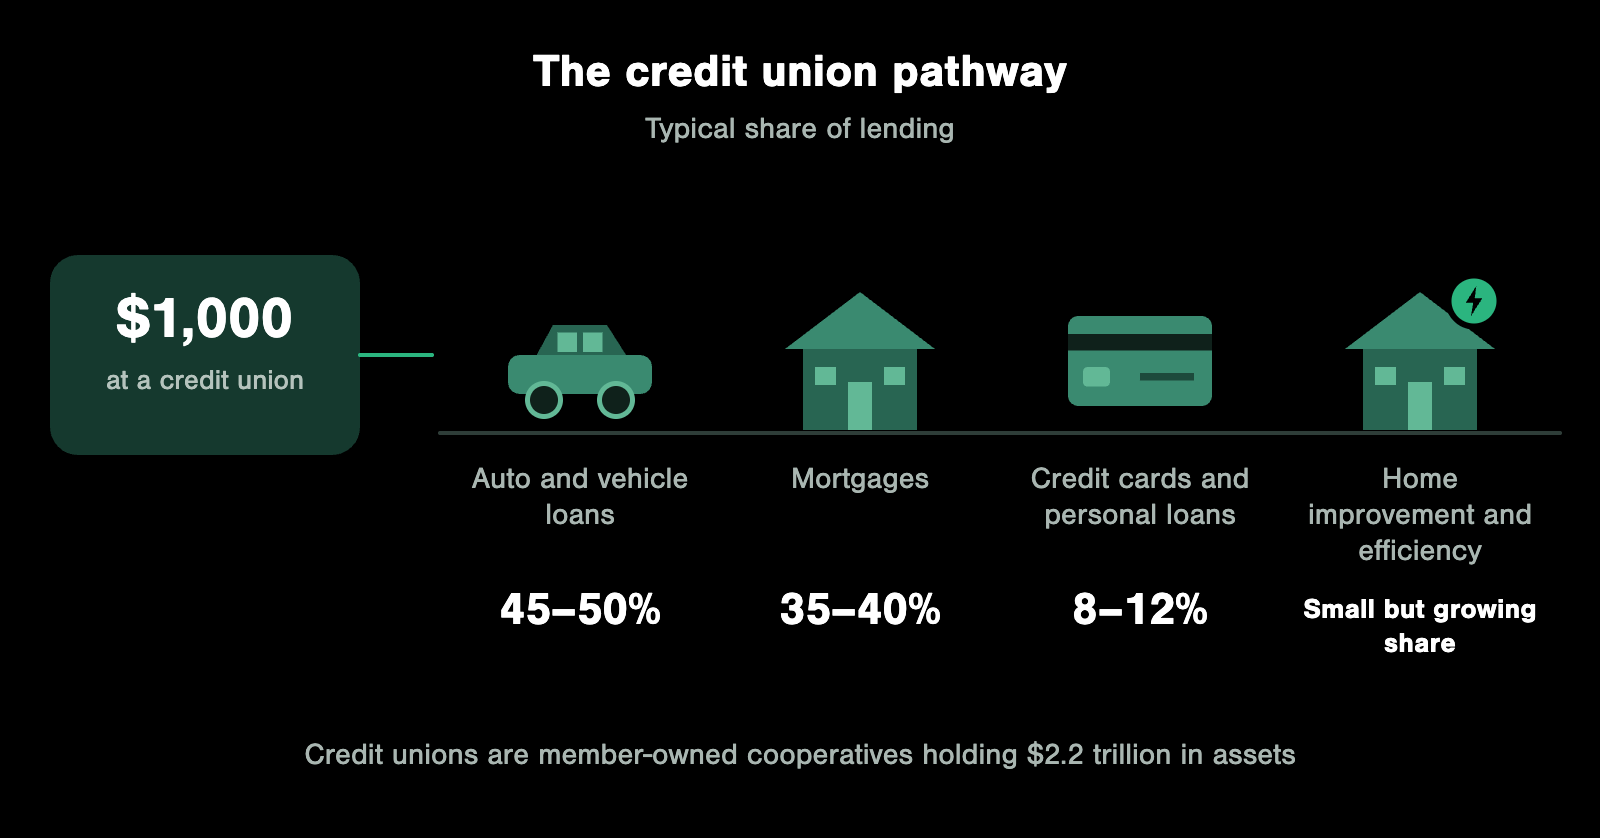
Credit unions hold $2.3 trillion in assets [3], and their balance sheets are strongly geared toward personal finance. This is structural: credit unions are member-owned cooperatives, and their lending reflects that orientation.
Roughly 45-50% of credit union lending goes to auto and consumer vehicle loans, 35-40% to mortgages, and 8-12% to credit cards and personal loans [3]. A small but increasing share now flows into home improvement and efficiency upgrades.
If you deposit $1,000 in a credit union, the loaned portion is highly likely to fund an auto loan, a first-time mortgage, debt consolidation, or modest efficiency-related home improvements. Institutions like Alliant Credit Union, PenFed, and Civic Credit Union (NC, formerly Local Government Federal Credit Union) operate in this space. Your $1,000 strengthens household-level resilience; credit unions directly affect whether individual families can access affordable credit for the purchases that most affect daily life.
Community Development Financial Institutions (CDFIs): where your $1,000 fills gaps
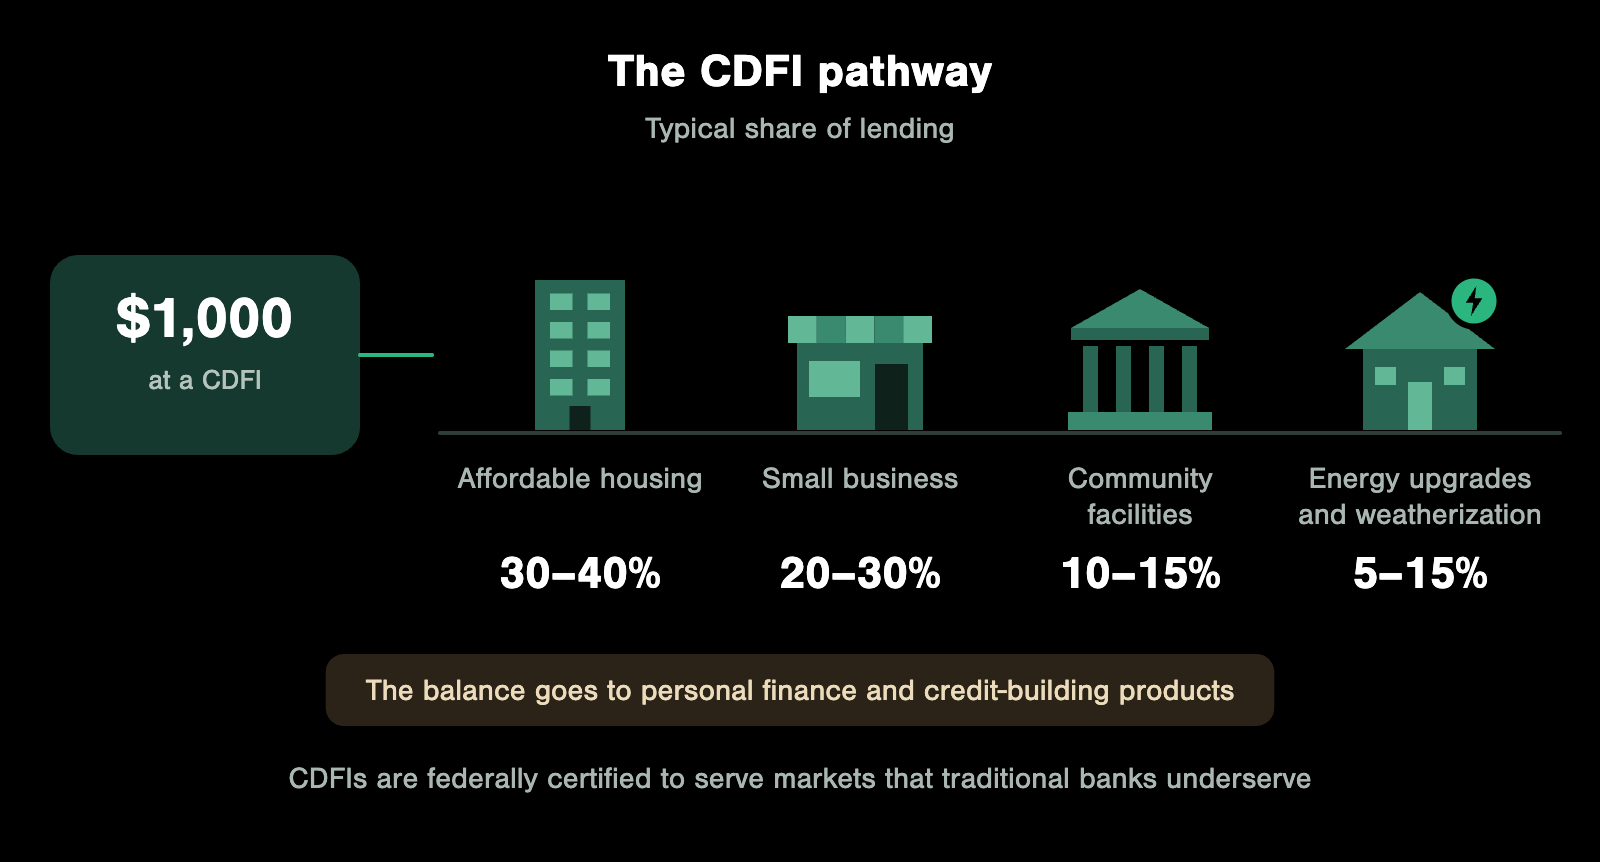
CDFIs are federally certified institutions serving markets that traditional banks underserve. According to U.S. Treasury CDFI Fund data [4], their lending composition is fundamentally different from mainstream banks: 30-40% flows into affordable housing, 20-30% into small business, 10-15% into community facilities, and 5-15% into energy upgrades, weatherization, and efficiency. The balance goes to personal finance and credit-building products.
If you deposit $1,000 at a CDFI, a larger share of the loaned portion flows into communities where capital is scarce. These are neighborhoods where a single small-business loan or an affordable housing project can shift an entire block’s economic trajectory. Institutions like Hope Credit Union (AL/AR/GA/LA/MS/TN), Beneficial State Bank (CA/OR/WA), and Sunrise Banks (MN) demonstrate this model in practice. Your $1,000 becomes catalytic, existing precisely to fill the gaps that market-rate lending leaves behind.
Modern energy-aligned institutions: where your $1,000 supports electrification
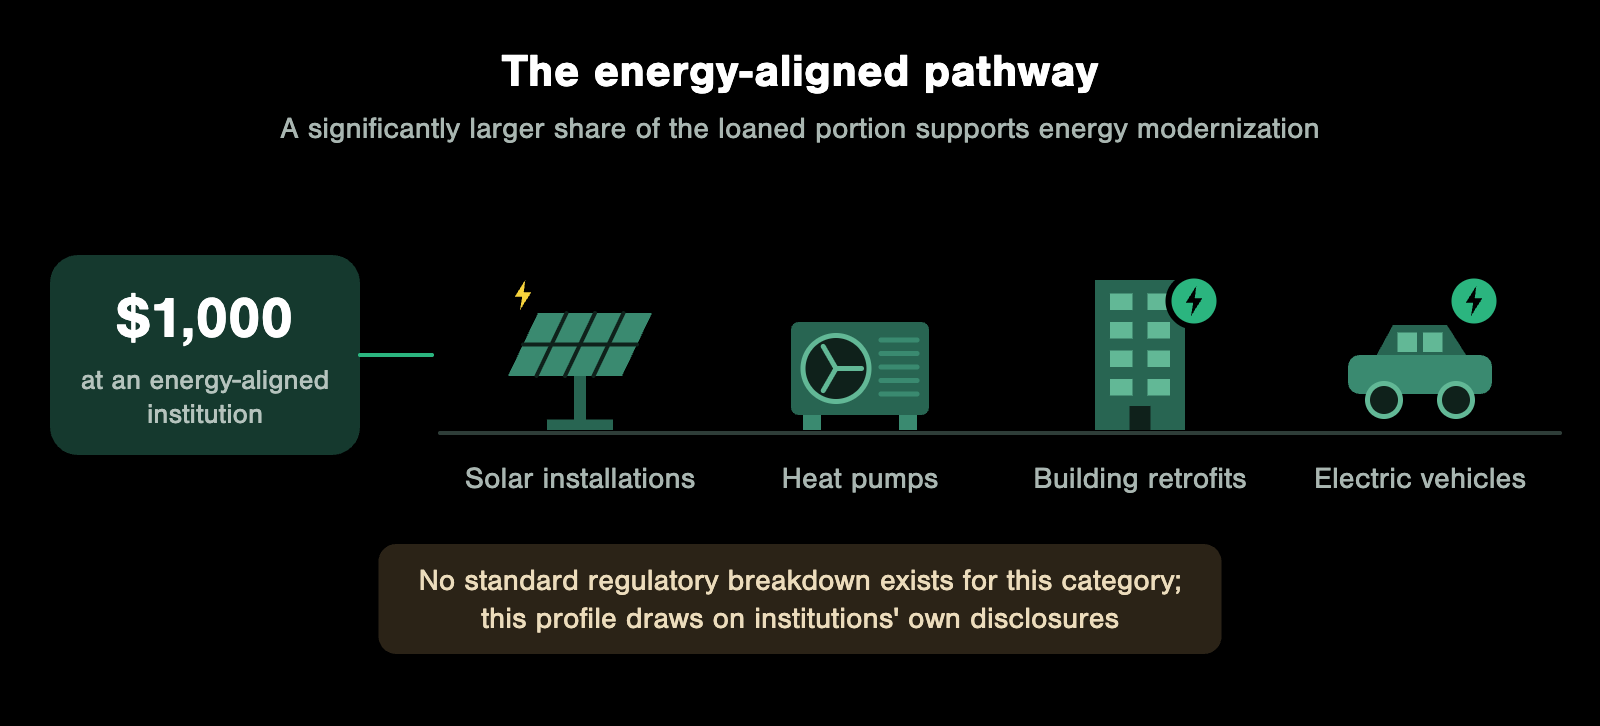
Some institutions are structurally oriented toward modern, efficient, next-generation energy technologies. Unlike commercial banks and credit unions, whose lending composition is reported through the Federal Reserve H.8 release and NCUA call reports, this category has no standardized supervisory breakdown. Drawing on institutions’ own published disclosures rather than a regulatory data series, lending here concentrates in clean-energy and building-efficiency loans, green home improvement and electrification, and EV-related lending [10].
If you deposit $1,000 in one of these institutions, a significantly larger share of the loaned portion supports energy modernization. These are loans that finance solar installations, heat pump systems, building retrofits, and electric vehicles. Clean Energy Credit Union is a federally insured example of this model.
Minority Depository Institutions (MDIs): where your $1,000 supports equity
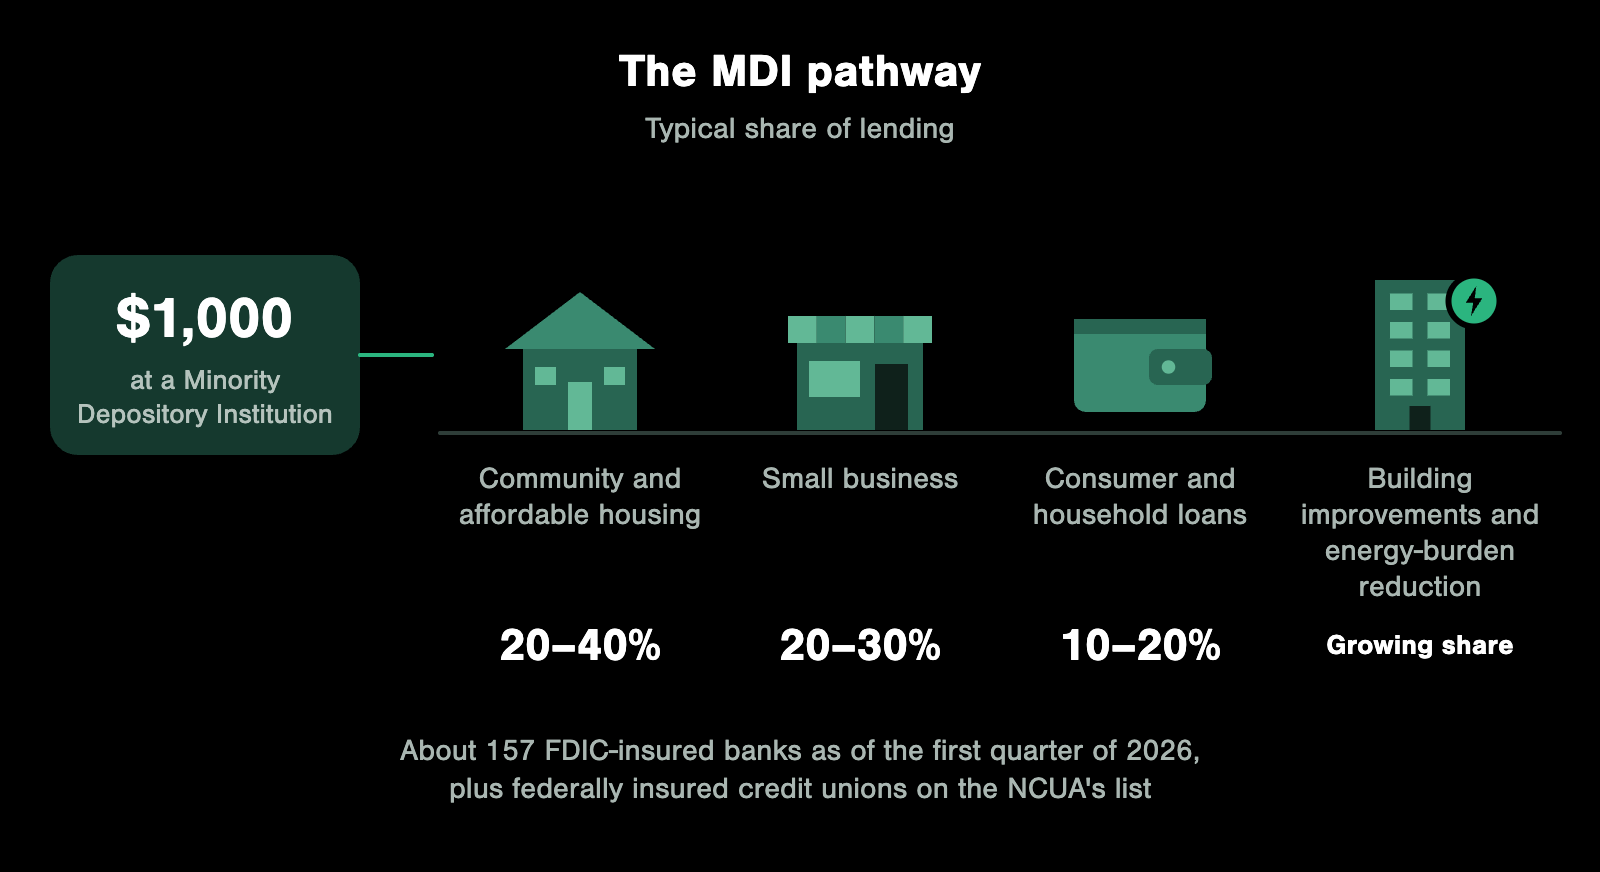
MDIs encompass about 157 FDIC-insured banks as of the first quarter of 2026, alongside a separate list of federally insured credit unions maintained by the NCUA [5][11], serving Black, Latino, Native American, and Asian American communities. Their lending typically emphasizes community and affordable housing (20-40%), small business lending (20-30%), and consumer and household loans (10-20%), with a growing share flowing into building improvements and energy-burden reduction [5].
If you deposit $1,000 in an MDI, the loaned portion flows into communities that historically faced systemic disinvestment. These institutions go beyond basic lending to rebuild financial infrastructure in places where it was deliberately dismantled or never adequately built. Carver Federal Savings Bank (NY), Latino Community Credit Union (NC), and Native American Bank, N.A. (CO) illustrate what this looks like. MDIs serve a dual function: expanding access to capital and directing that capital toward community stabilization simultaneously.
Why these differences matter
Each institution type influences who gets access to credit, where investment flows geographically, what gets upgraded or modernized, how households manage costs, which businesses survive or expand, and how quickly communities transition to efficient systems.
The goal is to understand the structure so you can choose a financial home aligned with your priorities:
| Institution type | Lending focus | Ideal for depositors who want to |
|---|---|---|
| Commercial banks | Broad-scale corporate, infrastructure, and real estate | Support mixed-sector growth and legacy systems |
| Community banks | Local small businesses and commercial real estate | Keep capital circulating in their local town or region |
| Credit unions | Auto loans, mortgages, and personal finance | Support cooperative banking and household affordability |
| CDFIs | Affordable housing and underserved markets | Direct capital to communities traditional finance misses |
| Energy-aligned institutions | Solar, electrification, and building efficiency | Accelerate the transition to a low-carbon economy |
| MDIs | Minority-owned businesses and community equity | Rebuild financial infrastructure in marginalized areas |
The key is gaining clarity.
Closing the loop: what your $1,000 ultimately means
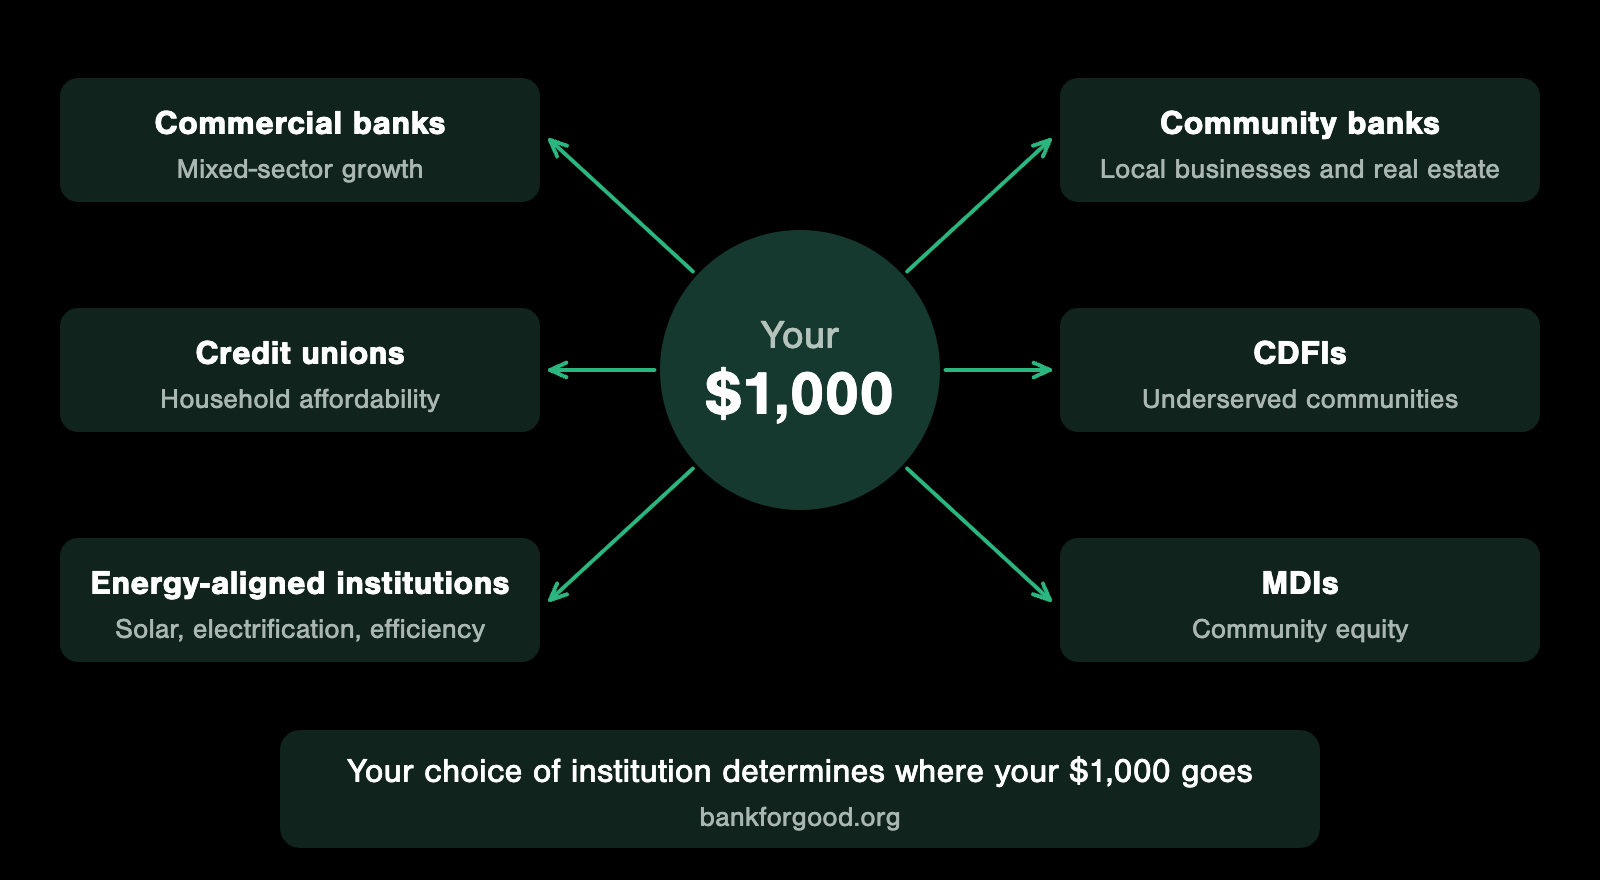
When you zoom out, your $1,000 becomes part of the capital that determines which homes get built, which businesses grow, which neighborhoods stabilize, which infrastructure gets maintained, which systems modernize, and who has access to opportunity.
Your deposit is highly active, and your choice of institution determines its trajectory.
That is why Bank for Good exists: to make these differences visible, approachable, and understandable so people can move their money with purpose and intention. Your $1,000 has a path. Now you know how to guide it.
Ready to make a move? The Bank for Good switching checklist
Switching banks is often perceived as a massive headache, but it is actually a straightforward process if you do it in the right order.
- Find your fit and open the account. Wait to close your old account.
Review the institution types above and choose your new financial home. You can usually open an account online in less than 15 minutes. Fund it with a small initial deposit to get it activated, leaving the bulk of your money in your old account for now. - Reroute your cash flow. Move your income first, then your bills.
Update your employer’s payroll system to send your direct deposits to the new account. Once you see your income landing there, update your automatic payments (utilities, credit cards, subscriptions, loan payments). Pro tip: leave a small cash buffer in your old account to catch any stray automatic payments you might have forgotten about. - Monitor, empty, and close. Wait one full billing cycle.
Let both accounts run in parallel for 30 to 45 days. Once you are certain all of your incoming money and outgoing bills have successfully transitioned, transfer your remaining balance to your new bank. Finally, officially request that your old bank close the account. Let them know exactly why you are leaving. If a bank knows it is losing deposits over its lending priorities, it is far more motivated to change.
Next: Part III: When the loan leaves the bank
Sources
- Federal Reserve H.8 Release (Nov 2025). https://www.federalreserve.gov/releases/h8/20251121/
- FDIC Community Banking Study and Quarterly Banking Profile (2024). https://www.fdic.gov/quarterly-banking-profile
- NCUA, Quarterly Credit Union Data Summary, 2024 Q4 (2025). https://ncua.gov/files/publications/analysis/quarterly-data-summary-2024-Q4.pdf
- U.S. Treasury CDFI Fund Annual Certification and Data Collection Report (2024). https://www.cdfifund.gov/research-data
- FDIC: Minority Depository Institutions List, First Quarter 2026. https://www.fdic.gov/minority-depository-institutions-program/minority-depository-institutions-list
- FDIC, Quarterly Banking Profile, Fourth Quarter 2024 (“Loans secured by real estate” and “Total loans and leases”) (2025). https://www.fdic.gov/quarterly-banking-profile/quarterly-banking-profile-q4-2024
- Federal Reserve H.8 Release (Table 2, line 10 “Commercial and Industrial Loans”) (Nov 2025). https://www.federalreserve.gov/releases/h8/20251121/
- FDIC, Quarterly Banking Profile, Fourth Quarter 2024 (“Loans to individuals” and “Total loans and leases”) (2025). https://www.fdic.gov/quarterly-banking-profile/quarterly-banking-profile-q4-2024
- Federal Financial Institutions Examination Council (FFIEC), “Findings from Analysis of Nationwide Summary Statistics for 2024 Community Reinvestment Act Data” fact sheet (2025). https://www.ffiec.gov/data/cra/findings-from-2024-data-fact-sheet
- Institutions’ own published lending disclosures, including Clean Energy Credit Union and Inclusiv member institutions. No standardized supervisory breakdown exists for this category.
- NCUA: List of Minority Depository Institutions (as of 30 June 2026). https://ncua.gov/support-services/credit-union-resources-expansion/minority-depository-institutions/list-mdis
Correction, July 2026: This article has been updated to reflect institutional name changes and to clarify the charter status of one named provider.

