The Hidden Power of a Bank Deposit, Part III: When the Loan Leaves the Bank
In this article
In Part I, we followed $1,000 from the moment you deposit it to the loans it helps fund: homes, businesses, cars, farms and everyday household credit. In Part II, we followed the same $1,000 through different kinds of institutions, from large commercial banks to credit unions, CDFIs and Minority Depository Institutions.
Both articles rested on one simplification, set out in a note at the end of Part I. The lending figures described the loans banks keep on their balance sheets. In practice, banks make far more loans than they keep. Many are sold soon after they are made, packaged into securities, or passed on to government-sponsored enterprises and non-bank lenders.
This third part follows those loans. It looks at what happens when a loan leaves the bank, who ends up holding it, and what that means for the $1,000 you deposited.
Making a loan and keeping it are two separate decisions
When a bank approves a loan, it makes two choices. The first is whether to lend at all, and on what terms. The second is whether to keep the loan on its own books or sell it.
Many loans, mortgages above all, are sold after they are made. Fannie Mae and Freddie Mac buy mortgages from lenders, then keep them or package them into mortgage-backed securities that investors buy [1]. The lender receives cash, which it can use to make new loans. The Small Business Administration describes the same logic for small business loans: selling the guaranteed part of a loan lets lenders “relend funds returned from the sale” [2].
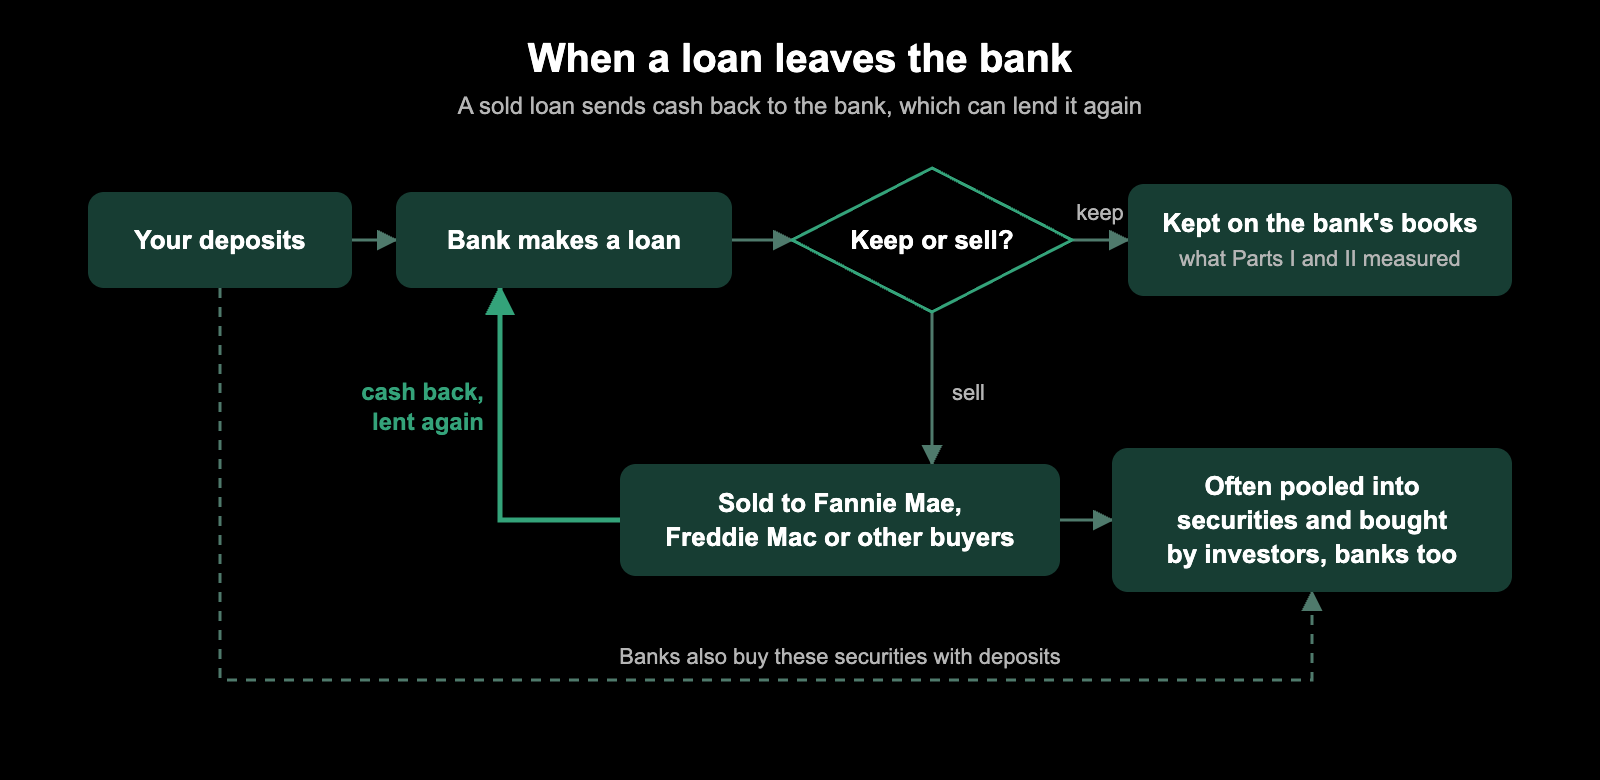
Banks also use deposits to buy those securities, so part of your $1,000 can end up funding a home loan that another lender made.
Public mortgage data show how many places a loan can go. Under the Home Mortgage Disclosure Act, lenders record who bought each loan they sold. The options include Fannie Mae, Freddie Mac, Ginnie Mae, Farmer Mac, private securitizers, other banks, credit unions, mortgage and finance companies, life insurers and affiliated companies [3].
The name on your monthly statement may not tell you who owns your loan. The servicer collects payments and manages the account, and the Consumer Financial Protection Bureau notes that a different company often takes over that role after the loan is made [4].
Mortgages: most are sold, and most end up in securities
Mortgages are where the gap between making and keeping a loan is widest. In the third quarter of 2025, lenders kept about 30% of new first-lien home loans in their own portfolios. About 38% were sold to Fannie Mae and Freddie Mac, about 25% were FHA and VA loans pooled into government-backed securities, and about 7% went into private-label securities [5].
Over the years, this adds up. Of every $1,000 of single-family mortgage debt in the US in mid-2025, about $648 sat in agency mortgage-backed securities. Banks held about $183 as first mortgages kept on their own books, and credit unions about $42 [5].
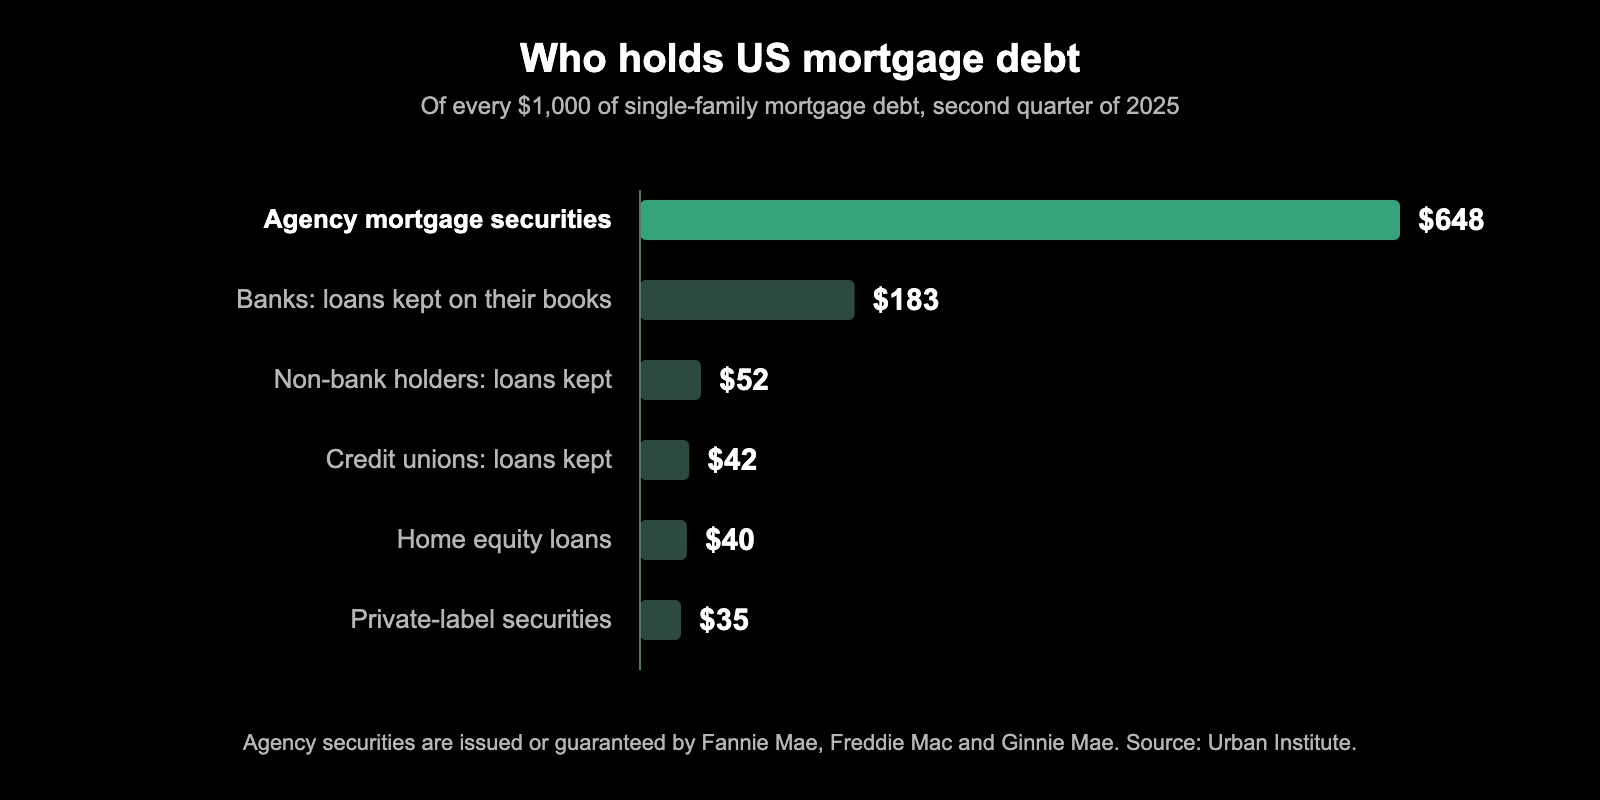
The rest is held as loans by other lenders, or sits in home equity loans and private-label securities.
Agency mortgage-backed securities outstanding came to more than $9.4 trillion at the end of November 2025: about $3.5 trillion issued by Fannie Mae, $3.1 trillion by Freddie Mac and $2.7 trillion by Ginnie Mae [5].
Banks and other depository institutions are the largest owners of those securities. In mid-2025, they held about $3.0 trillion, ahead of the Federal Reserve at about $2.1 trillion and foreign investors at about $1.4 trillion [5]. So a mortgage your bank sells can come back to the banking system as a security, bought with deposits.
Beyond mortgages: some loans stay, some move, some never reach a bank
Outside mortgages, what happens depends on the type of loan.
Credit cards mostly stay with banks. In October 2025, banks owned or managed about $1.17 trillion of the $1.28 trillion in revolving consumer credit, roughly nine dollars in every ten [6]. The Federal Reserve counts card loans that banks have securitized but still manage within the banks’ totals [7].
Car loans are spread more widely. US households owed $1.66 trillion in auto loans in the third quarter of 2025 [8]. Commercial banks held about $497 billion of auto loans in October 2025, about 30% of that total [9]. Credit unions and finance companies each held $640 billion to $700 billion of other household credit, a category that includes car loans [6].
Most student loans never pass through a bank. The federal government held about $1.57 trillion of consumer credit in October 2025, and its only consumer lending is student loans [6][7]. That is most of the $1.65 trillion in student debt households owed in the third quarter of 2025 [8].
Small business loans can be split. A lender making an SBA 7(a) loan can sell the part the government guarantees to investors, keep servicing the loan, and lend the proceeds again [2].
Non-bank lenders, and the banks that fund them
A large share of loans is now made by lenders that take no deposits at all. In November 2025, non-bank lenders accounted for about 84% of agency mortgage originations, the home loans that go into Fannie Mae, Freddie Mac and Ginnie Mae securities. The share ranged from about 75% for Fannie Mae loans to about 96% for Ginnie Mae loans [5].
Without deposits, these lenders rely on other funding, and banks are one source. The FDIC describes non-depository financial institutions as “financial entities that lend to consumers and nonfinancial companies.” They include mortgage lenders, finance companies, insurers, private equity and private credit funds [10].
Bank lending to these firms grew faster than any other type of bank loan between 2010 and 2024 [10]. By October 2025, commercial banks had about $1.71 trillion in loans to non-depository financial institutions, about 13% of all their loans [9]. Part of the recent increase reflects banks reclassifying existing loans when reporting rules changed in December 2024 [10].
This lending is concentrated in the largest banks. In the third quarter of 2025, banks with more than $100 billion in assets held about 86% of it, and ten banks held about 71% [10].
What this means for your $1,000
Part I followed the roughly $710 of every $1,000 deposited that banks hold as loans. The same Federal Reserve figures show two more routes your deposit takes, one inside the loans and one beside them [9].
| Where it sits on your bank’s balance sheet | Per $1,000 deposited | What it funds |
|---|---|---|
| Loans the bank holds | about $712 | Homes, businesses, cars, credit cards and more (Part I) |
| of which: loans to non-bank financial firms | about $93 | Mortgage companies, finance companies and private funds, which lend in turn |
| Securities | about $306 | Treasury and agency bonds, mortgage-backed securities and other bonds |
| of which: agency mortgage-backed securities | about $147 | Home loans made by any lender and sold into Fannie Mae, Freddie Mac or Ginnie Mae securities |
Three things follow. First, your deposit reaches borrowers through more routes than the loans your bank makes and keeps. It also funds home loans through the mortgage securities your bank buys, and other lenders through the loans your bank makes to them.
Second, a sold loan returns cash that can be lent again [1][2]. Over time, the same deposits can help fund more loans than a bank’s balance sheet shows at any one moment.
Third, the bank that made a loan decided who received it and on what terms, even when someone else now holds it.
Why where you bank still matters
The choice of bank still shapes where your $1,000 goes, for three reasons.
Your bank decides who gets credit in the first place. Whether it keeps a loan or sells it, the bank that made it chose the borrower, the terms and the place.
What a lender makes can be seen, even when it sells. Under the Home Mortgage Disclosure Act, reporting lenders record each mortgage they make and, for loans they sell, the type of buyer [3].
What a bank keeps and buys reflects its priorities. Banks differ in how much of their deposits they hold as their own loans, how much they put into securities, and how much they lend to other financial firms. Lending to non-bank financial firms, for example, is concentrated in the largest banks [10].
On Bank for Good, the social impact view on each bank page shows where an institution’s loans go, from the quarterly reports banks file with the FDIC and credit unions file with the NCUA. Those reports show the loans an institution holds at the end of each quarter, so loans it has already sold are not included.
If you want to know more, ask your bank or credit union:
- Do you keep the mortgages you make, or sell them? If you sell them, to whom?
- Who services the loans you sell?
- How much of your deposits do you hold as loans, and how much in securities?
- Do you lend to non-bank lenders or private credit funds?
Our letter to your bank is a good place to start. Your $1,000 keeps moving after a loan is made, and where you bank decides where it starts.
A note on the data in this article
Bank balance sheet figures come from the Federal Reserve’s H.8 release (data for October 2025, published November 2025), the same source as Part I. Amounts per $1,000 divide each item by commercial bank deposits ($18.47 trillion) and scale the result to $1,000.
Mortgage market figures come from the Urban Institute’s December 2025 chartbook, which draws on the Federal Reserve’s Financial Accounts of the United States, Inside Mortgage Finance and eMBS. Holdings are for the second quarter of 2025, new loans for the third quarter, and agency securities outstanding and the non-bank share for November 2025.
Consumer credit by holder comes from the Federal Reserve’s G.19 release for October 2025, which counts securitized loans within the holder that manages them. Household debt totals come from the New York Fed’s report for the third quarter of 2025.
These sources differ in scope and timing. The H.8, for example, covers commercial banks only. Figures from different sources should not be added together. The G.19 figures for October 2025 were marked preliminary when published.
Sources
- Federal Housing Finance Agency, About Fannie Mae and Freddie Mac. https://www.fhfa.gov/about-fannie-mae-freddie-mac
- US Small Business Administration, Secondary Market Program and Securitizations Guide (June 2020). https://www.sba.gov/sites/default/files/2020-06/Secondary%20Market%20Program%20Guide%20June%202020%20%28508%20Compliant%29.pdf
- Federal Financial Institutions Examination Council and CFPB, Public HMDA: LAR Data Fields. https://ffiec.cfpb.gov/documentation/publications/loan-level-datasets/lar-data-fields
- Consumer Financial Protection Bureau, What’s the difference between a mortgage lender and a servicer? https://www.consumerfinance.gov/ask-cfpb/whats-the-difference-between-a-mortgage-lender-and-a-servicer-en-198/
- Urban Institute, Housing Finance at a Glance: A Monthly Chartbook, December 2025 (2025). https://www.urban.org/research/publication/housing-finance-glance-monthly-chartbook-december-2025
- Federal Reserve G.19 Consumer Credit release, major holders, not seasonally adjusted, data for October 2025 (Dec 2025). https://www.federalreserve.gov/releases/g19/20251205/default.htm
- Federal Reserve, About the G.19 Consumer Credit release. https://www.federalreserve.gov/releases/g19/about.htm
- Federal Reserve Bank of New York, Household Debt and Credit Report, third quarter 2025 (press release, Nov 2025). https://newyorkfed.org/newsevents/news/research/2025/20251105
- Federal Reserve H.8 Release, “Assets and Liabilities of Commercial Banks in the United States” (Table 2, seasonally adjusted, lines 2, 4, 9, 23, 26 and 34) (Nov 2025). https://www.federalreserve.gov/releases/h8/20251121/
- FDIC, Bank Lending to Nondepository Financial Institutions, Banking Issues in Focus, Kate Fritzdixon and Joycelyn Lu (Feb 2026). https://www.fdic.gov/analysis/bank-lending-nondepository-financial-institutions.pdf

